NextGen Energy ($NXE) is a Canadian uranium exploration and development company focused on advancing its high-grade Arrow deposit in the Athabasca Basin in Saskatchewan. With a robust portfolio of uranium assets and a strong emphasis on sustainable development, NXE is poised to play a significant role in the global transition to clean energy, particularly as nuclear power gains momentum as a low-carbon energy source.
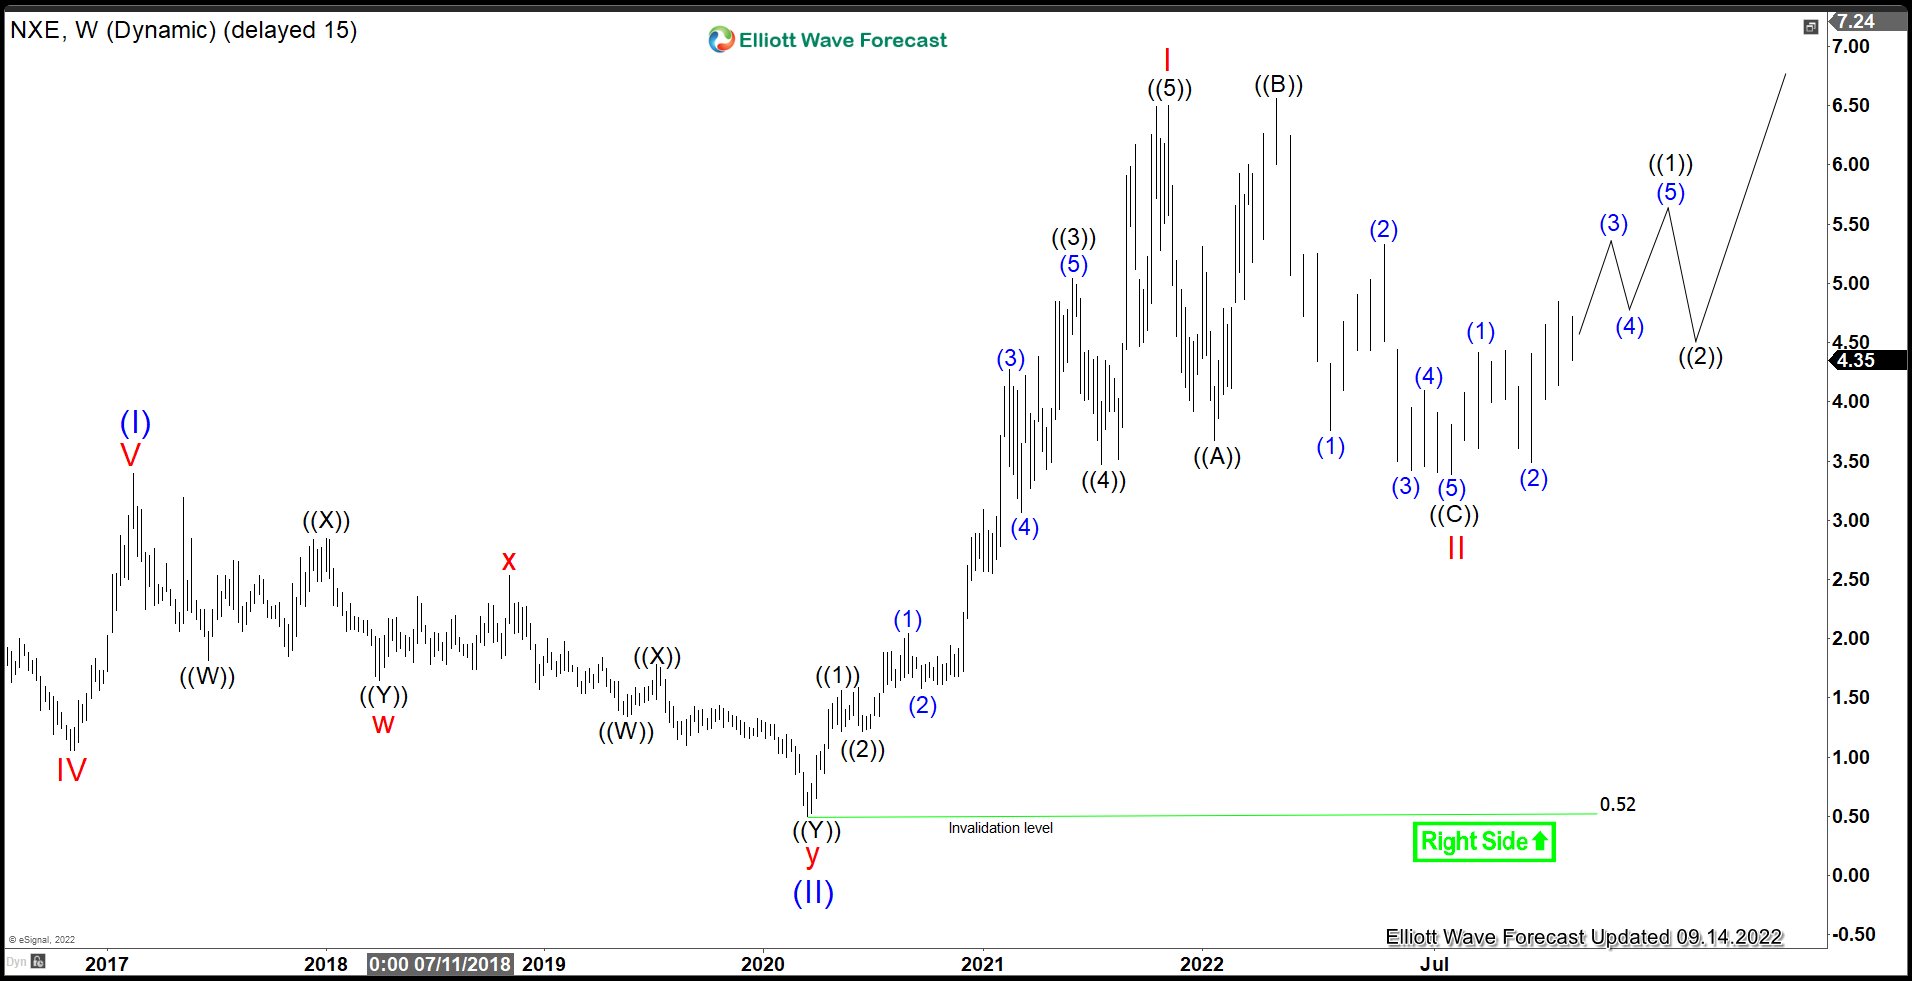
In our previous article, we wrote that NextGen Energy was ready for the the next leg higher in coming years. Below is what the weekly chart we posted in September 2022 looking for a rally higher in years to come.
$NXE Weekly Elliott Wave Chart from September 2022
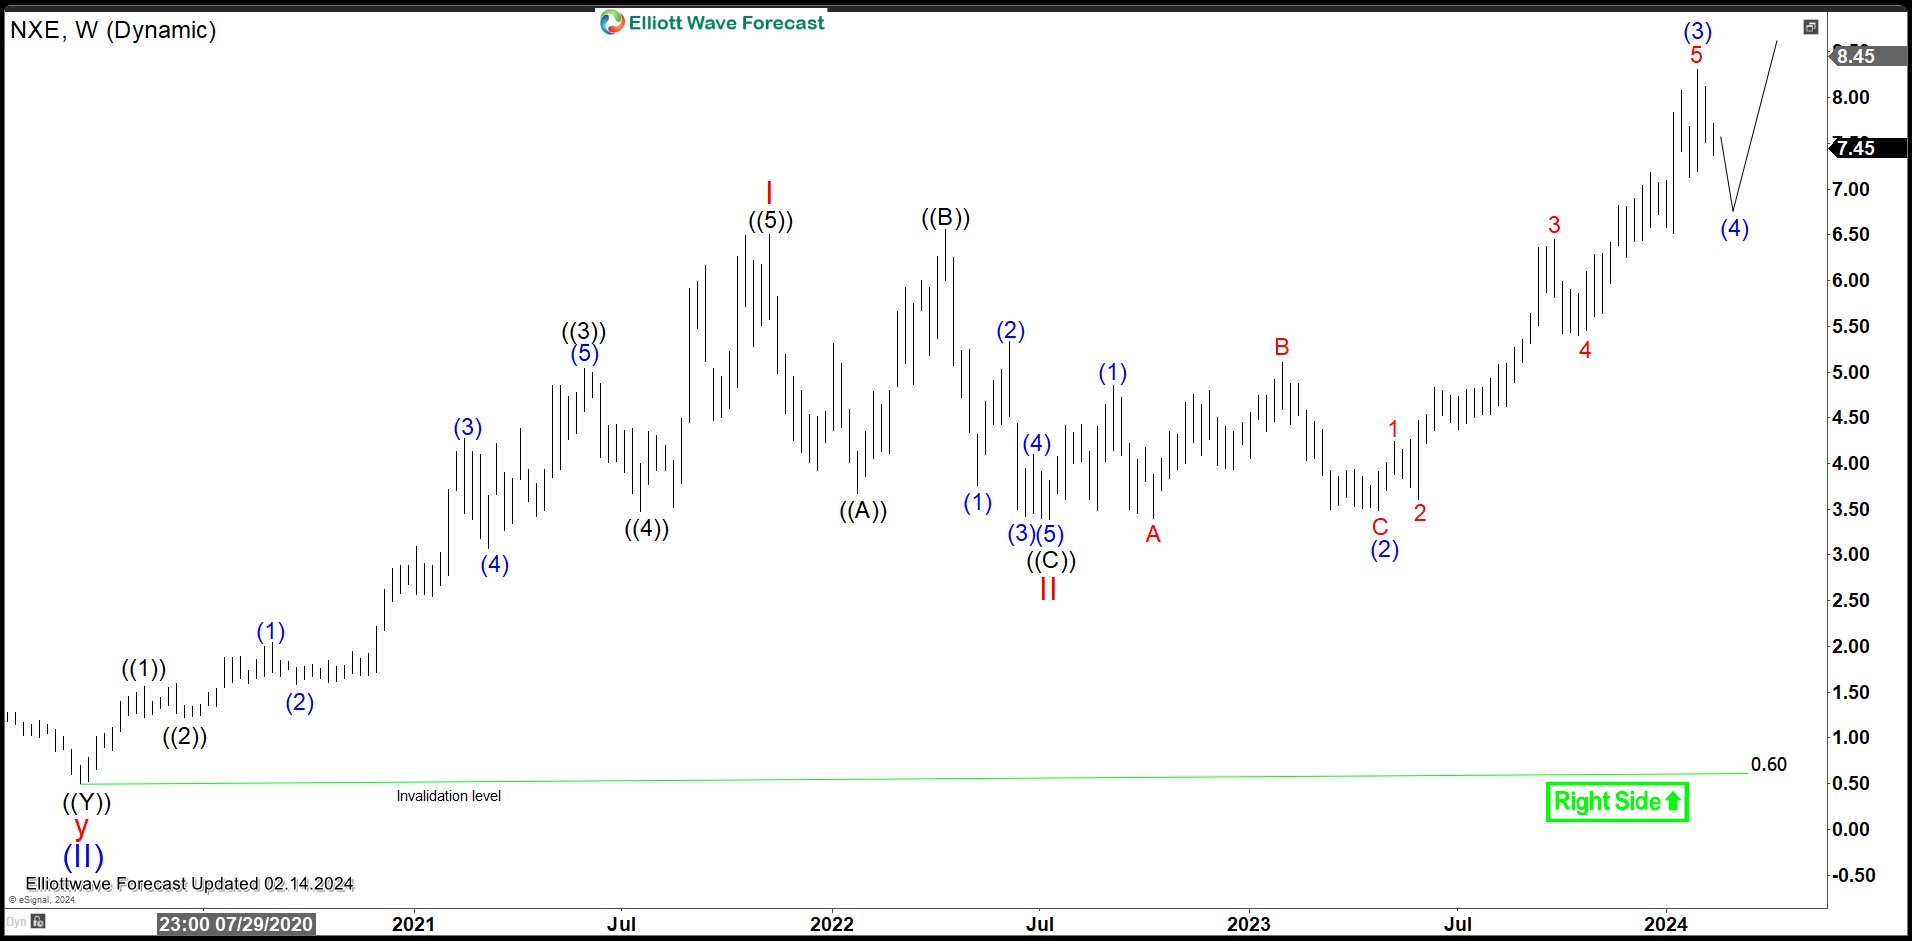
$NXE Weekly Elliott Wave Chart – Latest Update as of February 14, 2024
Above is the latest weekly chart of NextGen Energy where we can see the stock did rally higher as expected in the past 1+ years. Up from wave (II) low, wave I ended at 6.50 and pullback in wave II ended at 3.39. The stock then resumed higher in wave III. Expect the stock to continue to extend higher in years to come.
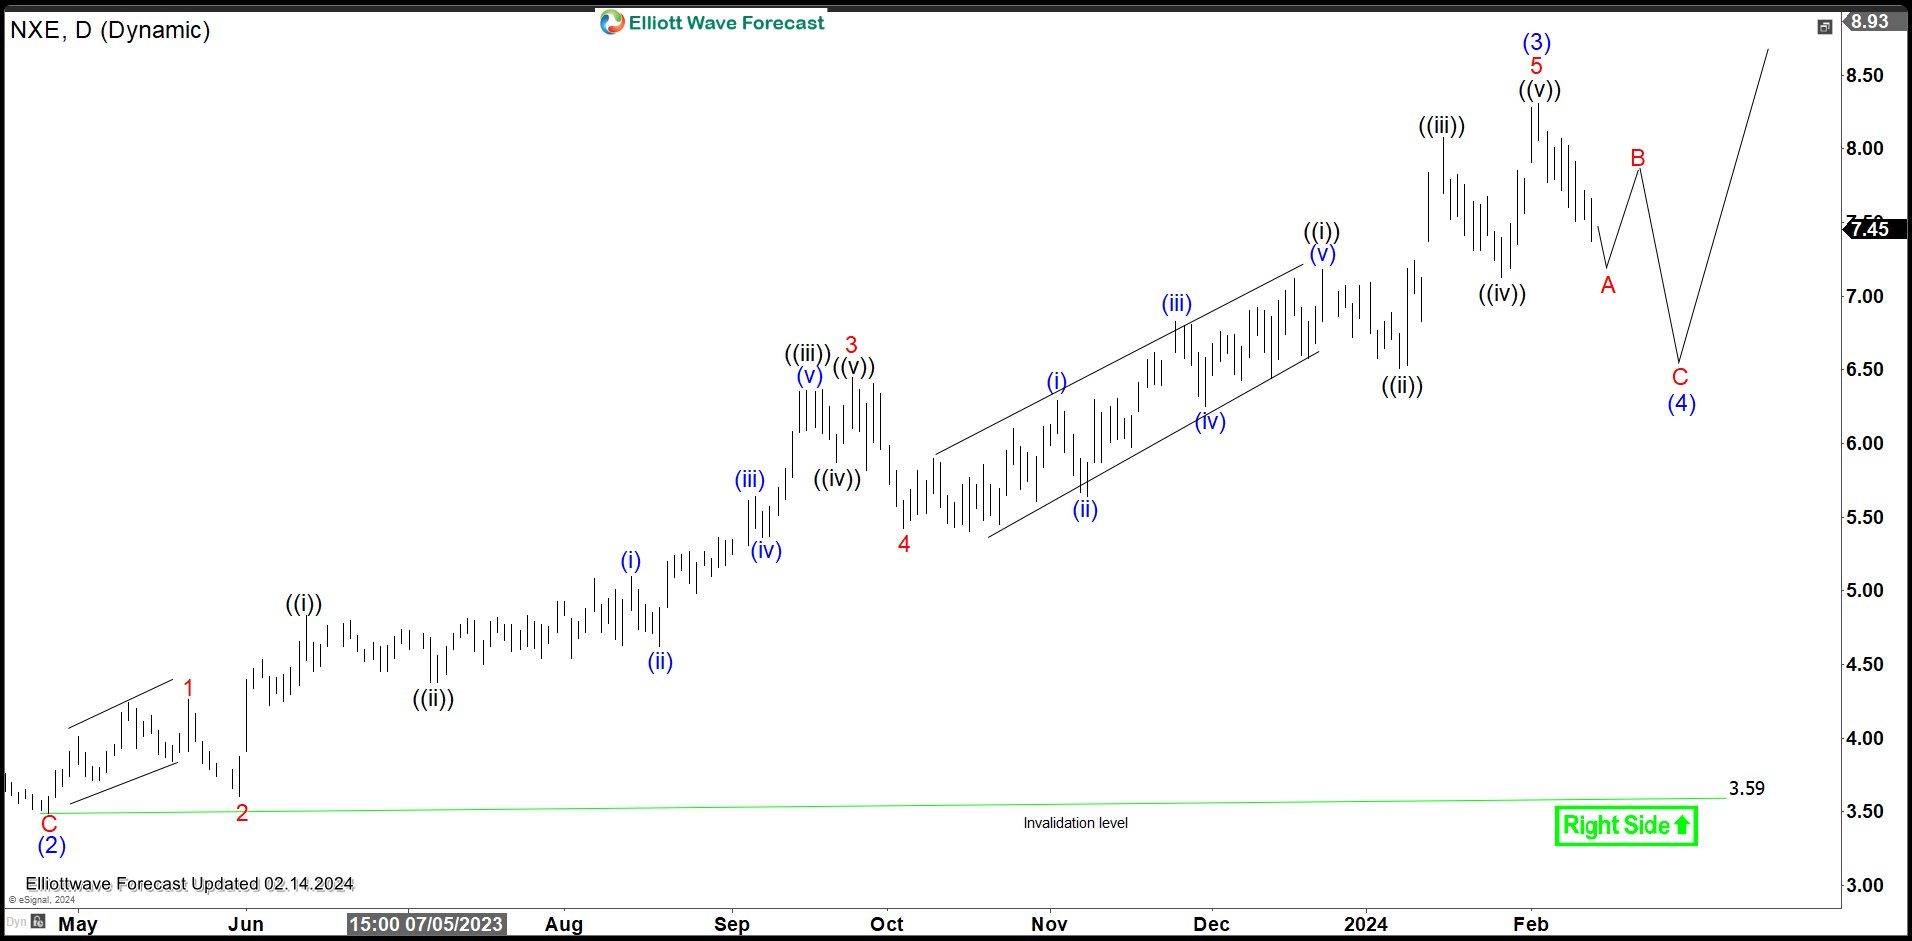
$NXE Daily Elliott Wave Chart – Latest Update as of February 14, 2024
Daily Elliott Wave Chart of NextGen Energy (NXE) above shows that the stock ended wave (2) on 4.35.2023 at 3.59. It then resumed higher in wave (3) which completed at 8.31. Wave (4) pullback is in progress in 3, 7, or 11 swing to correct rally from 4.25.2023 low before it resumes higher. Near term, as far as pivot at 3.59 low stays intact, expect pullback to find support in 3, 7, 11 swing for further upside.
We provide Elliott Wave charts for 78 instrument divided in 3 groups. We cover forex, Indices, commodities, U.S. stocks and ETF. If you’d like to know more about our service, please feel free to check our trial here –> 14 days Trial


