Covestro AG (formerly, Bayer MaterialScience) is a German company which produces a variety of polycarbonate and polyurethane based raw materials. The products include coatings and adhesives, polyurethanes for thermal insulation and electrical housings, polycarbonate based highly impact-resistant plastics (Makrolon) and more. Formed in 2015 as a spin off from Bayer, Covestro is headquartered in Leverkusen, Germany. As a part of DAX40 index, one can trade it under the ticker $1COV at Frankfurt Stock Exchange. In the initial Article from June 2021, we have forecasted a pullback to happen. Thereafter, a new cycle higher should continue the uptrend. Here, we present un update discussing an opportunity of buying a pullback.
Covestro Weekly Elliott Wave Analysis 04.03.2022
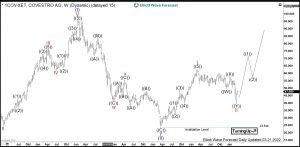
The weekly chart below shows the Covestro stock $1COV traded at XETRA. From the IPO lows in October 2015, the stock price has developed a cycle higher in blue wave (I) of super cycle degree towards the all-time highs on January 2018 at 95.78. From the highs, a correction lower in blue wave (II) has unfolded as an Elliott wave double three pattern. It has printed an important bottom on March 2010 at 23.54.
From March 2010 lows, a new cycle in wave (III) has already started and should extend towards 95.78 highs and even higher.
Covestro Daily Elliott Wave Analysis 04.03.2022
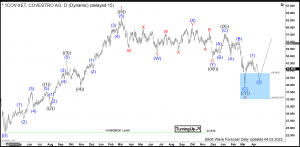
The daily chart below shows in more detail the first stages of the advance higher in blue wave (III). From the March 2020 lows, red wave I has developed an impulse higher towards March 2021 highs at 63.24. Within wave I, there are 5 black subwaves ((1))-((5)). Hereby, the wave ((5)) shows an extension.
From the March 2021 highs, a correction lower in wave II is demonstrating a larger double three pattern. First, the black wave ((W)) has ended on the 30th of November 2021. In itself, wave ((W)) is a smaller degree double three structure. Then, a bounce in connector wave ((X)) has ended on January the 5th, 2022. While below the peak at 58, the wave ((Y)) has been expected to reach lower into 43.97-35.27 area. As a matter of fact, it has reached it already. We are calling the correction in wave ((Y)) of II completed on 7th of March. From the 39.50 lows, a new cycle in wave ((1)) of III might have started. Currently, pullback in wave (2) should correct part of the rise within wave (1) and find support above 39.50 lows in 3, 7, 11 swings.
Investors and traders can buy wave (2) from 43.97-39.50 area. The target for wave III will be the 79.18-103.69 area and even beyond.
Get more insights about Stocks and ETFs by trying out our services 14 days . You’ll learn how to trade the market in the right side using the 3, 7 or 11 swings sequence. You will get access to our 78 instruments updated in 4 different time frames, Live Trading & Analysis Session done by our Expert Analysts every day, 24-hour chat room support and much more.


