Short Term Elliott Wave View in Silver (XAGUSD) suggests cycle from 12.19.2024 low is in progress as 5 waves.
Current Wave Count
- Wave (1) ended at 33.39
- Wave (2) pullback completed at 30.80
- Wave (3) now in progress
Detailed Wave Structure
Wave (2) Pullback
The correction formed a zigzag pattern:
- Wave A: 33.39 → 31.88
- Wave B: 31.88 → 33.20
- and then Wave C: 33.20 → 30.80 (completed)
Current Wave (3)
The rally from 30.80 shows this structure:
- Wave 1: 30.80 → 32.76
- Wave 2: Currently correcting (32.76 → ?)
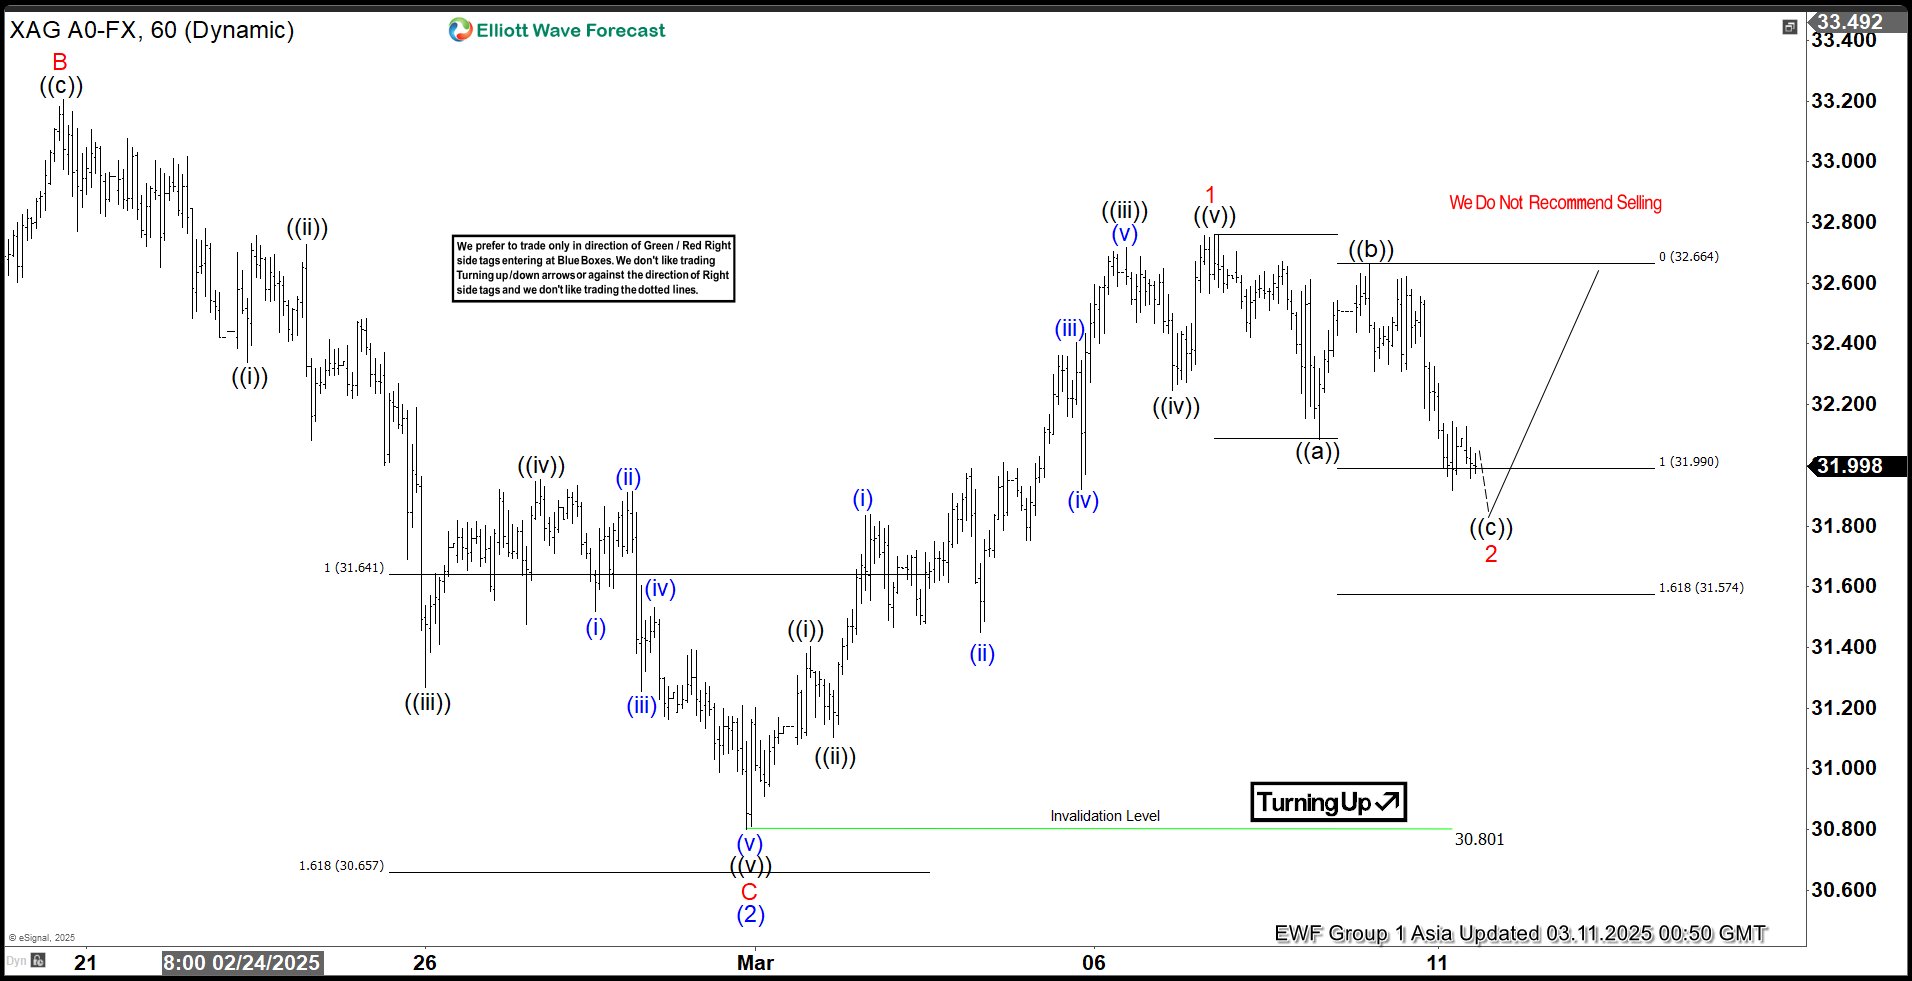
The metal has turned higher in wave (3). Up from wave (2), wave ((i)) ended at 31.4 and wave ((ii)) ended at 31.1. Wave ((iii)) higher ended at 32.72 and pullback in wave ((iv)) ended at 32.24. Final leg wave ((v)) ended at 32.76 which completed wave 1 in higher degree. Pullback in wave 2 is in progress to correct cycle from 2.28.2025 low before it resumes higher. Down from wave 1, wave ((a)) ended at 32.08 and wave ((b)) ended at 32.66. Expect wave ((c)) of 2 to end above 30.8 invalidation level for the next leg higher. As far as pivot at 30.8 low stays intact, expect pullback to find support in 3, 7, 11 swing for more upside.
Key Trading Levels
| Level | Importance |
|---|---|
| 30.80 | Critical support (must hold) |
| 32.08-32.24 | Near-term support zone |
| 33.39+ | Next upside target |
Silver 60-Minute Elliott Wave Chart
Silver Video Analysis
Trading Strategy
- Watch for support between 32.08-32.24
- 30.80 is absolute invalidation level
- Next upside target at 33.39+
- Monitor 3/7/11 swing patterns for entries
