In the bigger picture, Bitcoin has been in sideways consolidation since topping out at $13880 on June 26. It did a 3 waves pullback to $9049.54 on July 17 and since then has been sideways. Further correction in larger degree can’t be ruled out as a double zigzag structure from June 26 high, but the crypto-currency needs to break below $9049.54 to validate this view.
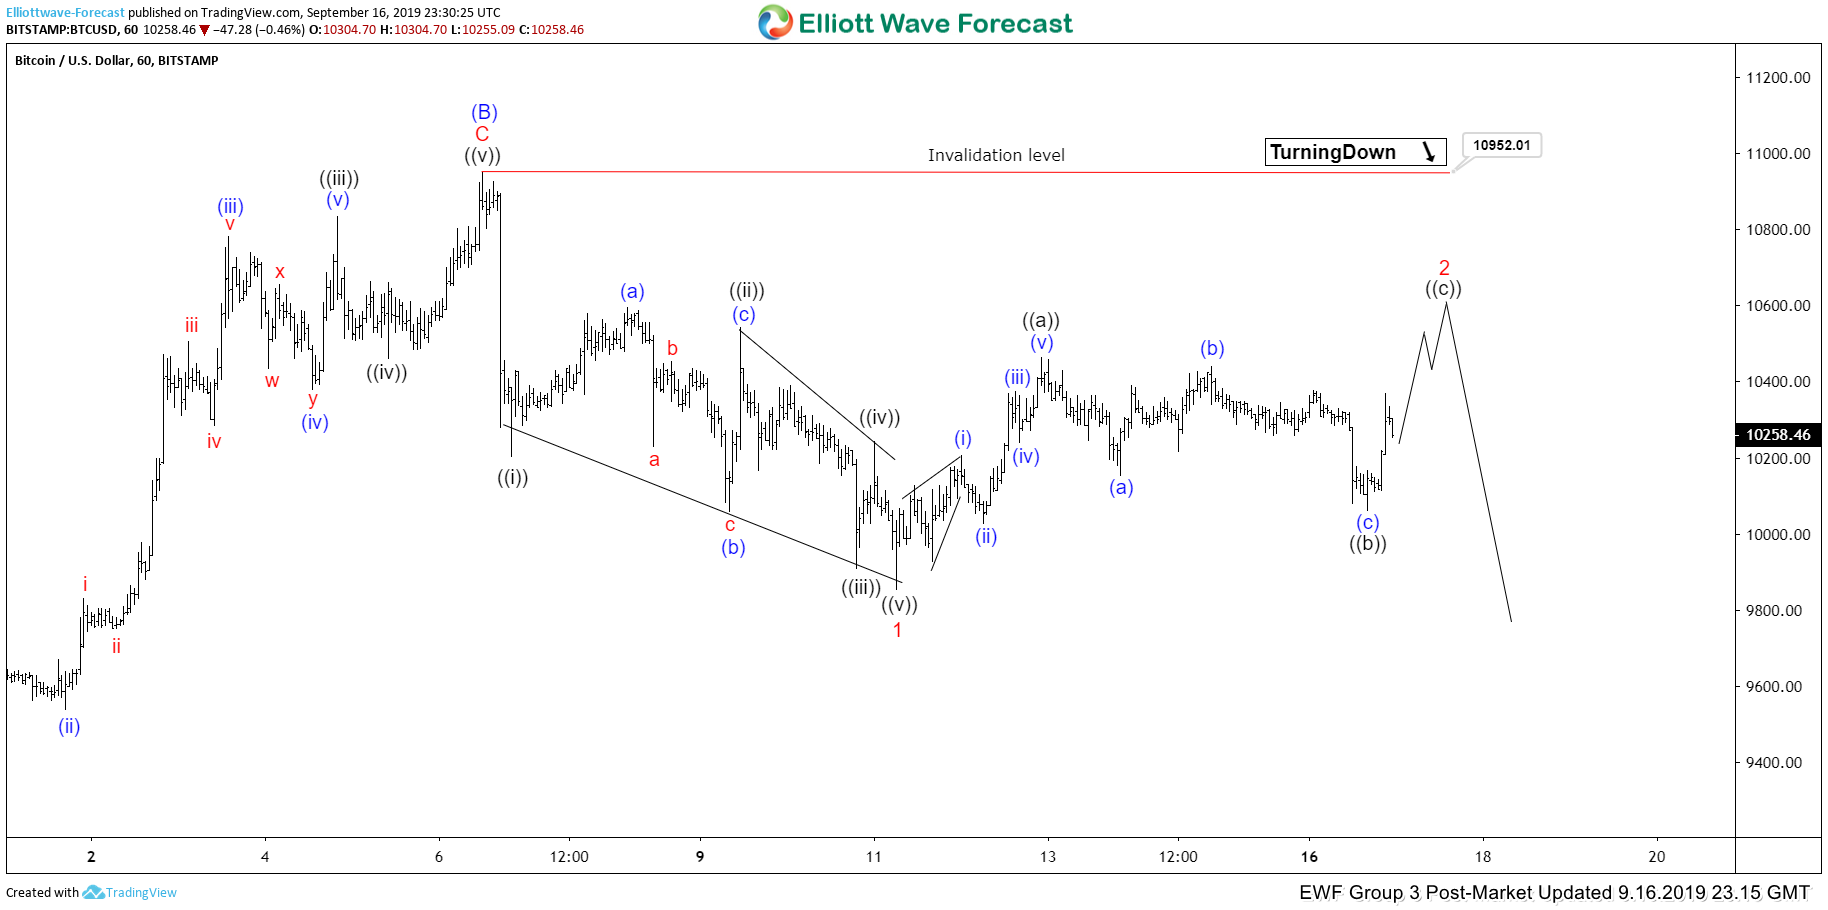
In short term, chart below suggests that Bitcoin’s rally to 10952.01 ended wave (B). The crypto-currency has since turned lower and the decline to 9855.11 on September 11 ended wave 1. The internal of wave 1 unfolded as a leading diagonal Elliott Wave structure where wave ((i)) ended at 10204.18 and wave ((ii)) ended at 10542.93. Wave ((iii)) ended at 9910, wave ((iv)) ended at 10243.01 and wave ((v)) of 1 ended at 9855.11.
Wave 2 rally is in progress to correct the decline from September 6 high (10952.01) as a zigzag structure. Up from 9855.11, wave ((a)) ended at 10465 with the internal as an impulse. Wave ((b)) pullback ended at 10060.95 and wave ((c)) is expected to rally in 5 waves. Potential target for wave ((c)) comes at $10672 – $10816 where wave ((c)) = wave ((a)). From this area, Bitcoin can then turn lower again as far as pivot at 10952.01 high stays intact.


