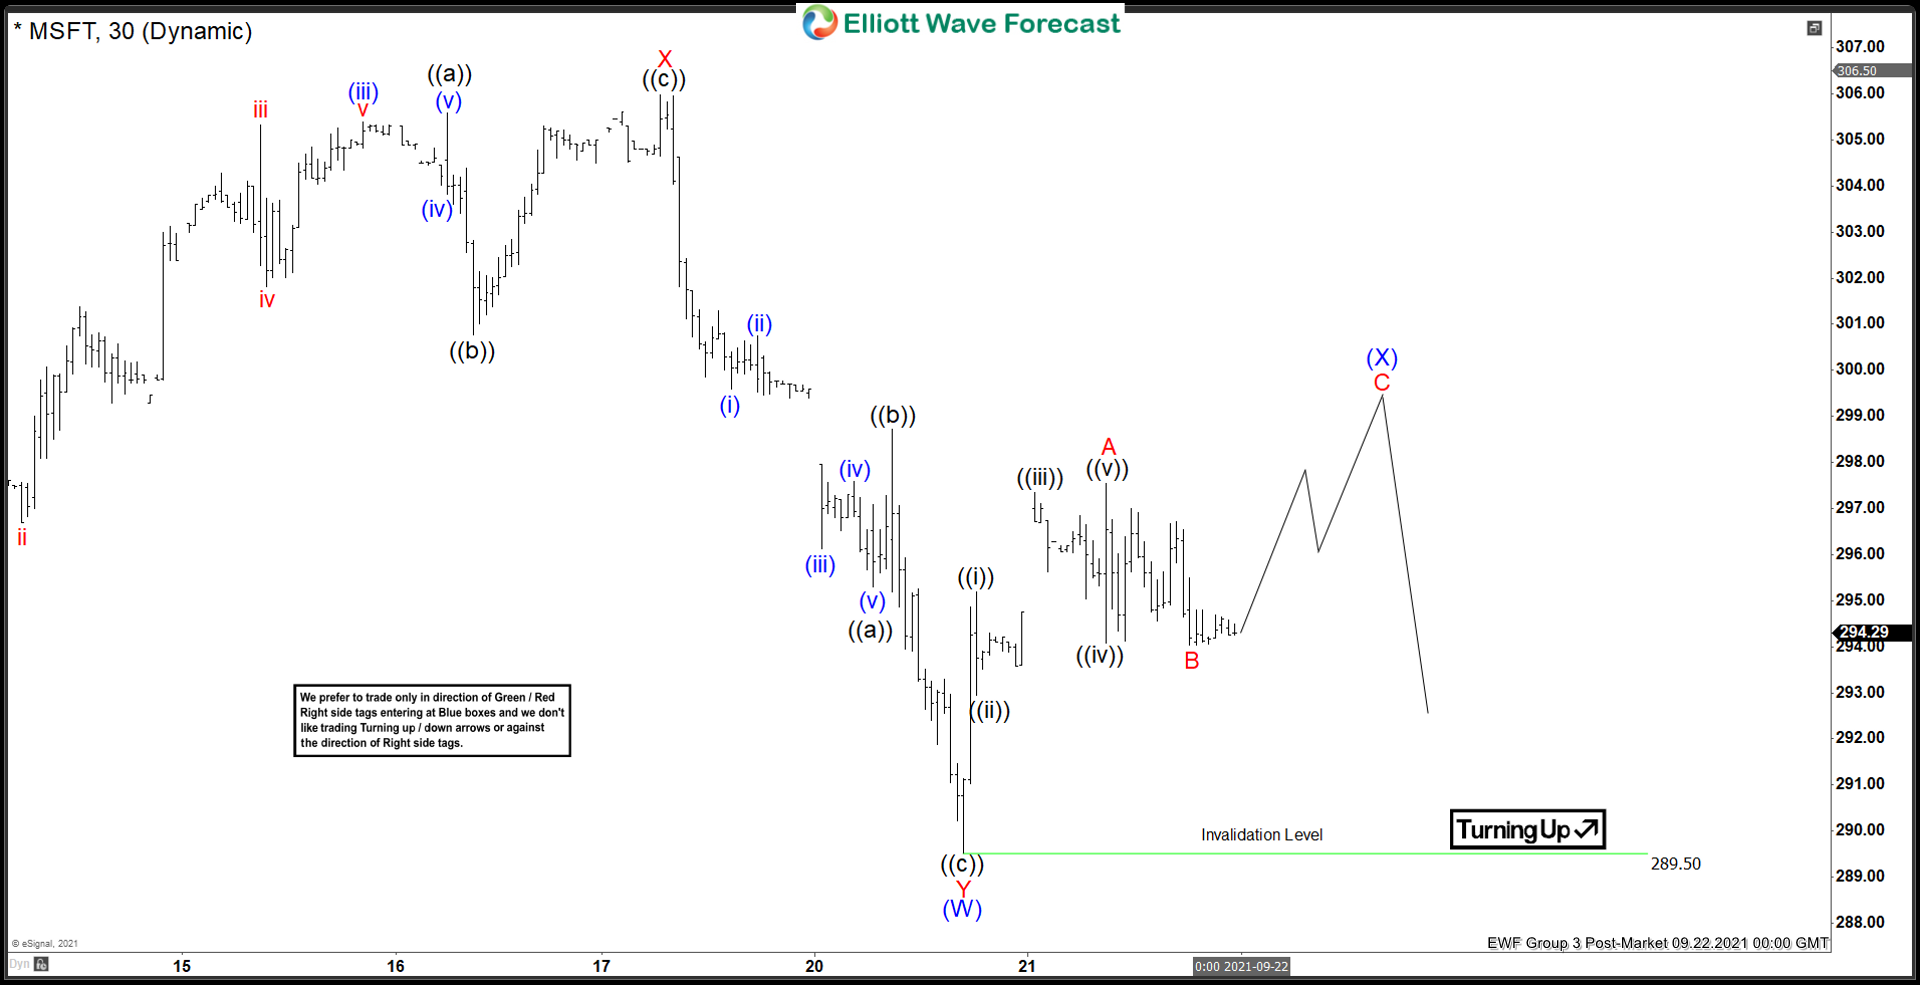
Short Term structure in Microsoft (MSFT) suggests the decline from August 20, 2021 is unfolding as a double three Elliott Wave structure. Down from August 20, wave W ended at 294.08 and rally in wave X ended at 305.32. Down from there, wave Y ended at 289.5 as a zigzag. Wave ((a)) of Y ended at 295.30 and wave ((b)) of Y ended at 298.72. Stock then resumed lower in wave ((c)) of Y towards 289.50. This completed wave (W) in higher degree.
Rally in wave (X) is in progress to correct cycle from August 20 high with the internal subdivision as a zigzag Elliott Wave structure. Up from wave (W), wave ((i)) ended at 295.2 and pullback in wave ((ii)) ended at 292.95. Stock then resumed higher in wave ((iii)) towards 297.35, wave ((iv)) ended at 294.07, and wave ((v)) ended at 297.54. This completed wave A of (X). Expect wave B pullback to stay above 289.50 for another possible leg higher in wave C of (X) before the stock resumes lower. Near term, while rally continues to stay below August 20 high (305.84), expect rally to fail in 3, 7, or 11 swing for further downside.


