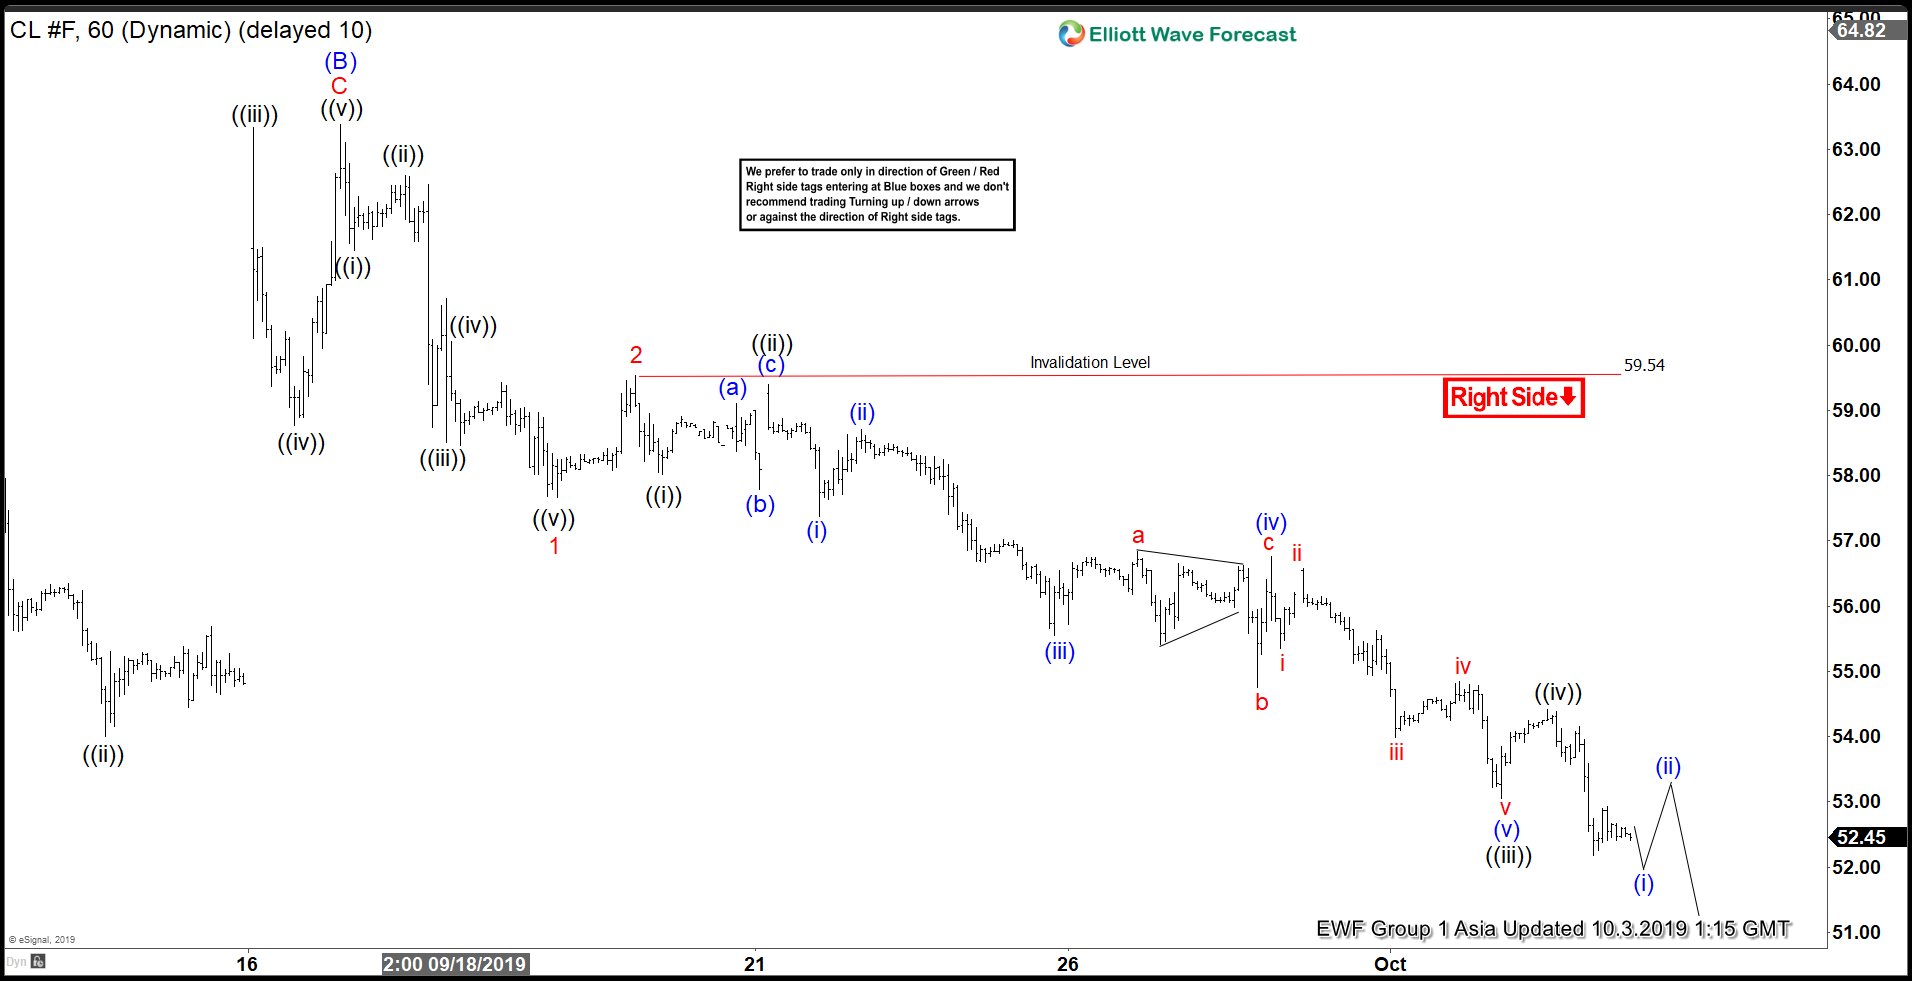
Short term Elliott Wave view on Oil suggests wave (B) rally ended at 63.38 on September 17, 2019 high. The commodity has since turned lower within wave (C) which is unfolding as 5 waves impulse Elliott Wave structure. This view will get validation when it breaks below the previous low on August 7, 2019 low (50.52). Down from 63.38, wave 1 ended at 57.67 and the bounce to 59.54 ended wave 2. Oil then resumes lower in wave 3 which is extended and subdivides as an impulse in lesser degree.
Wave ((i)) of 3 ended at 58.01 and wave ((ii)) of 3 ended at 59.39. Wave ((iii)) of 3 ended at 53.05 and wave ((iv)) of 3 ended at 54.42. Near term, while bounce stays below 59.54, expect Oil to extend lower to continue the 5 waves move from September 17, 2019 high (63.38). We don’t like buying Oil and as far as pivot at 59.54 stays intact, expect any bounce to fail in 3, 7, or 11 swing and Oil to resume lower. Potential target to the downside is 100% fibonacci extension area from April 23, 2019 high which comes at 43.62 – 47.38.
CL_F 1 Hour Elliott Wave Chart


