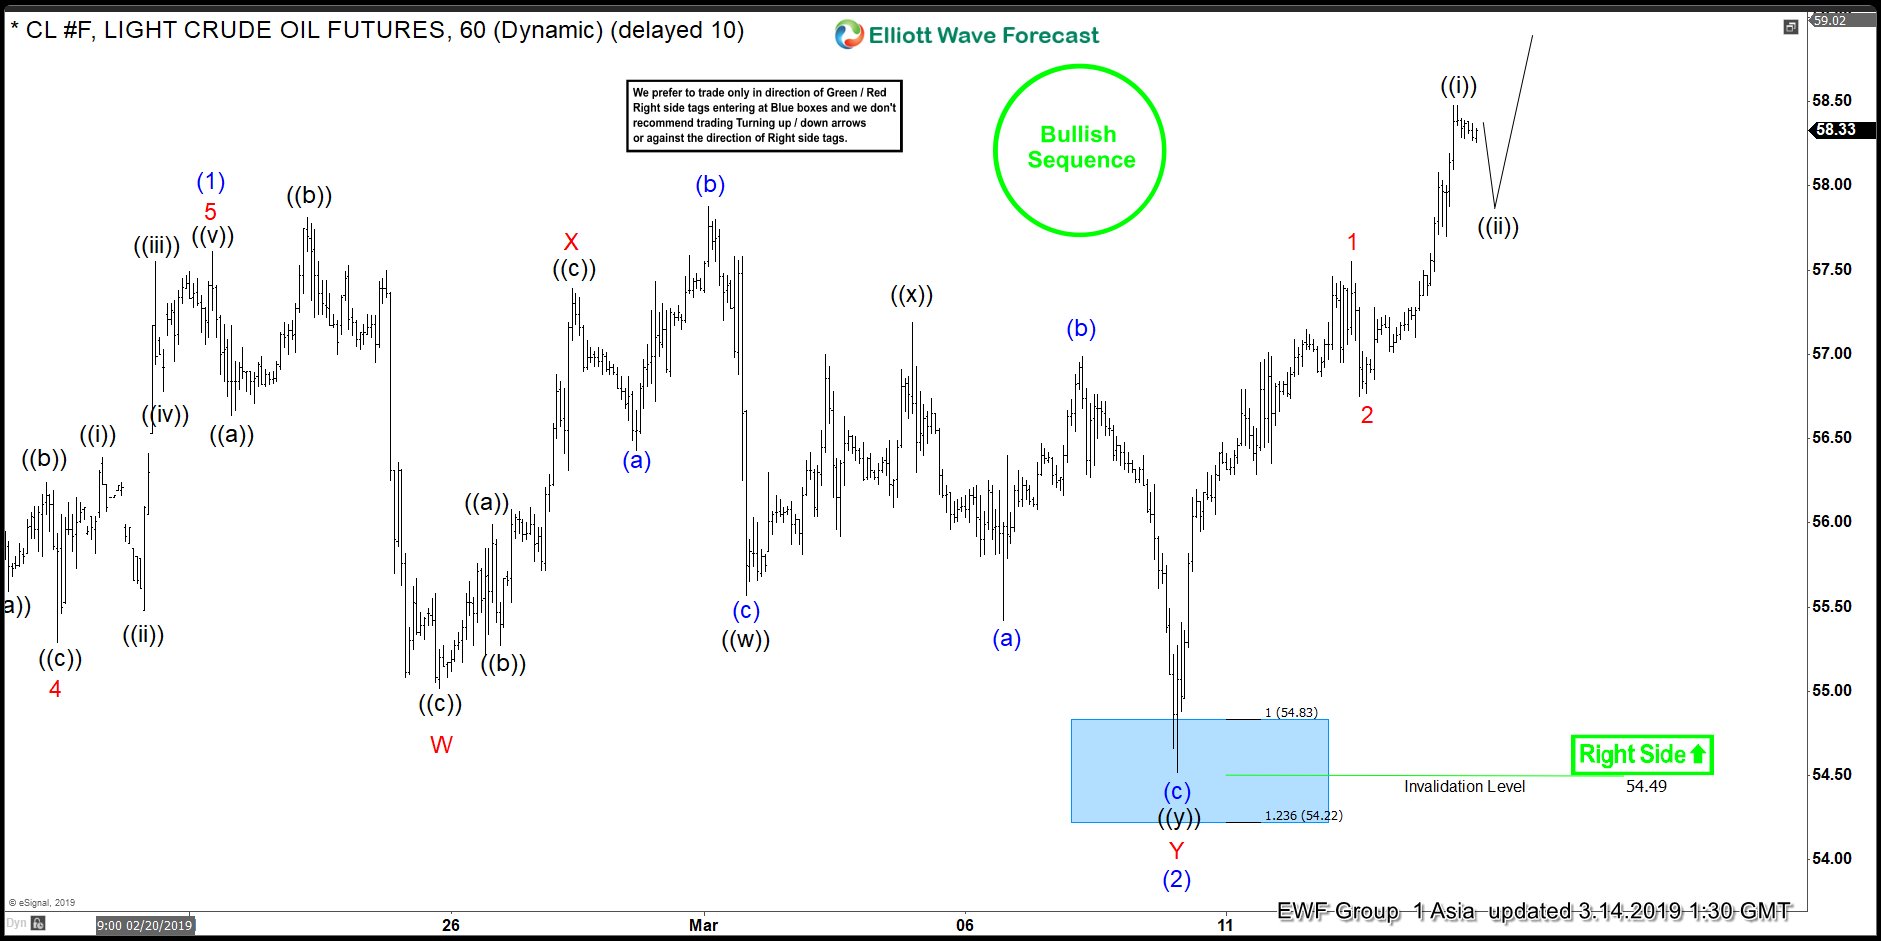
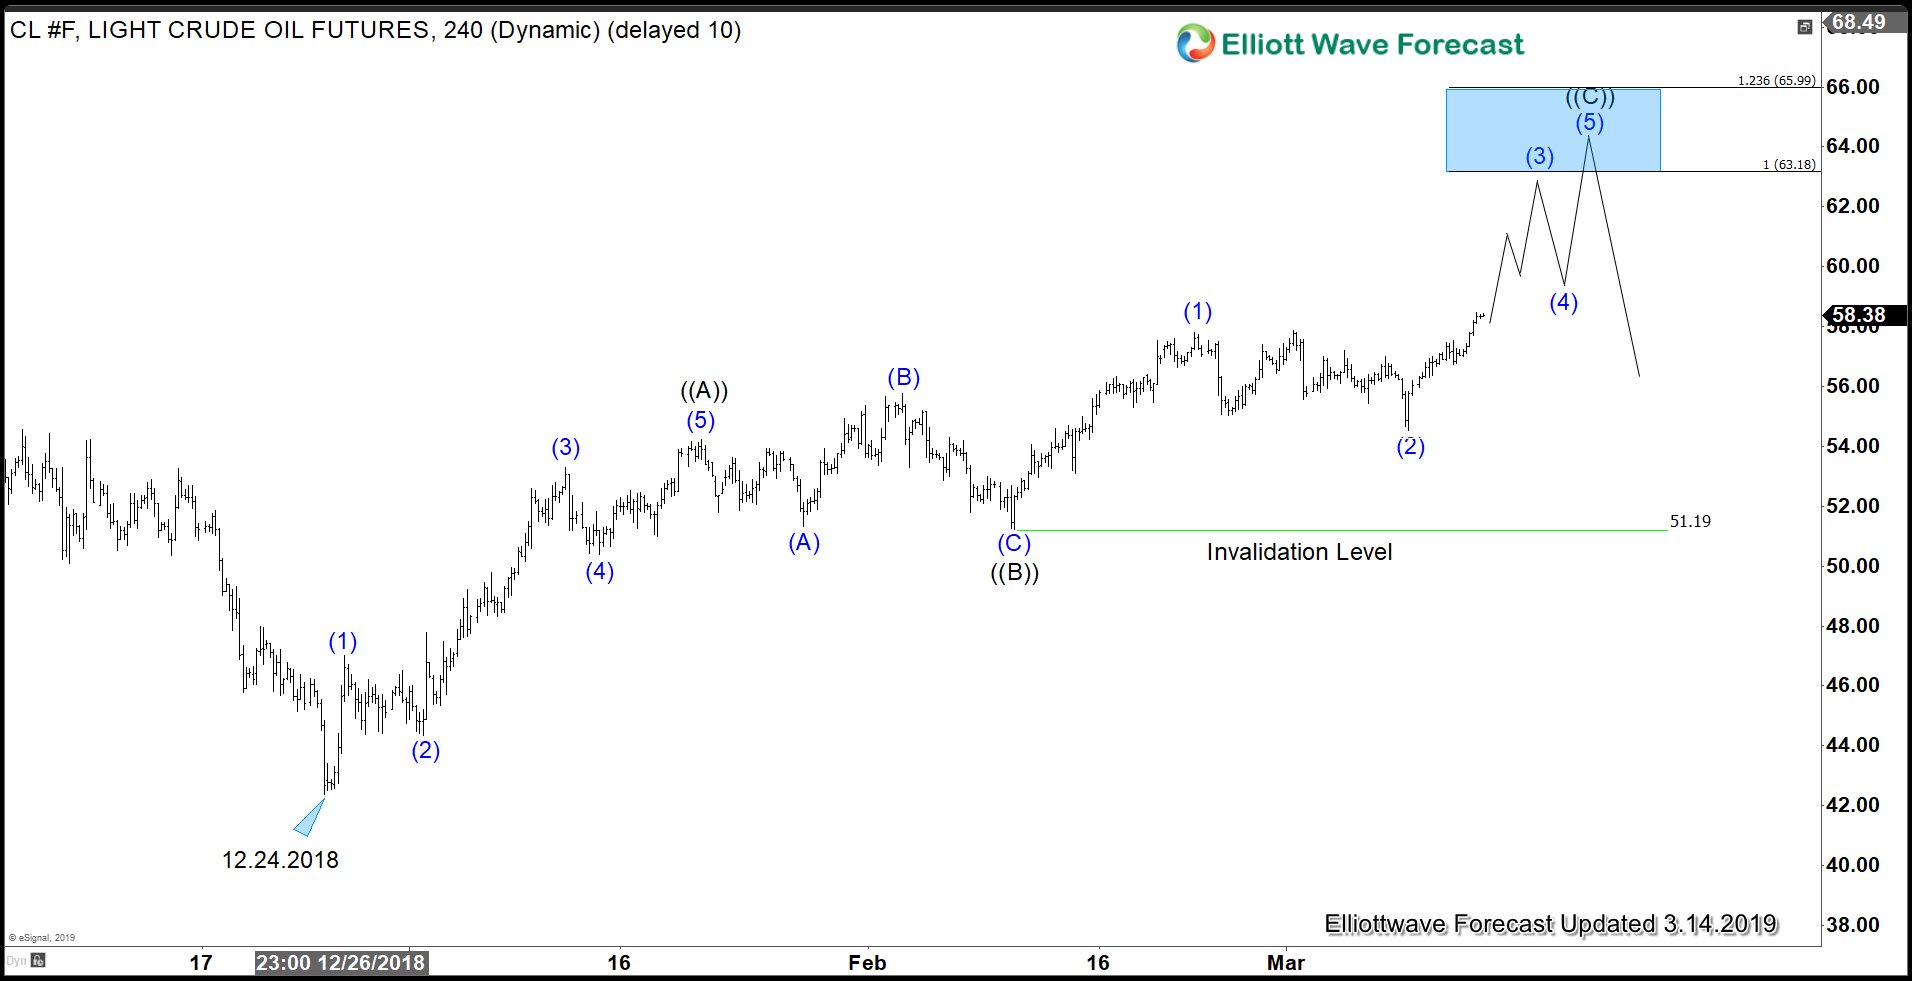
In our previous Chart of The Day on February 28, we suggested that Crude Oil (CL_F) is on the verge of a breakout. It has now confirmed our view as price extends higher and breaks above March 1 high at $57.88. The production output’s curb by the OPEC members as well as the political upheaval in Venezuela have contributed to the strength in Oil. Technical wise, the sequence remains bullish from both Dec 24, 2018 low and Feb 11, 2019 low. In the chart below, we can see a bullish sequence stamp and right side up to clearly show the direction that we prefer.
Since forming intermediate high on February 21 at $57.61, Oil has been in sideways and complex correction. The rally to $57.61 ended wave (1), and wave (2) pullback has ended at $54.49. The internal of wave (2) unfolded as a double three Elliott Wave structure. Down from $57.61, wave W ended at $55.02, wave X ended at $57.39, and wave Y of (2) ended at $54.52. Oil has since rallied and broken to new high above March 1 high ($57.88). This confirms the view that the next leg higher has started. Near term, while dips stay above $54.49, expect Oil to resume higher. A 100% extension from December 24, 2018 low can see Oil reaching $63.2 -$66 area next. The 4 hour chart below shows the sequence of higher high and higher low since December 2018 low.


