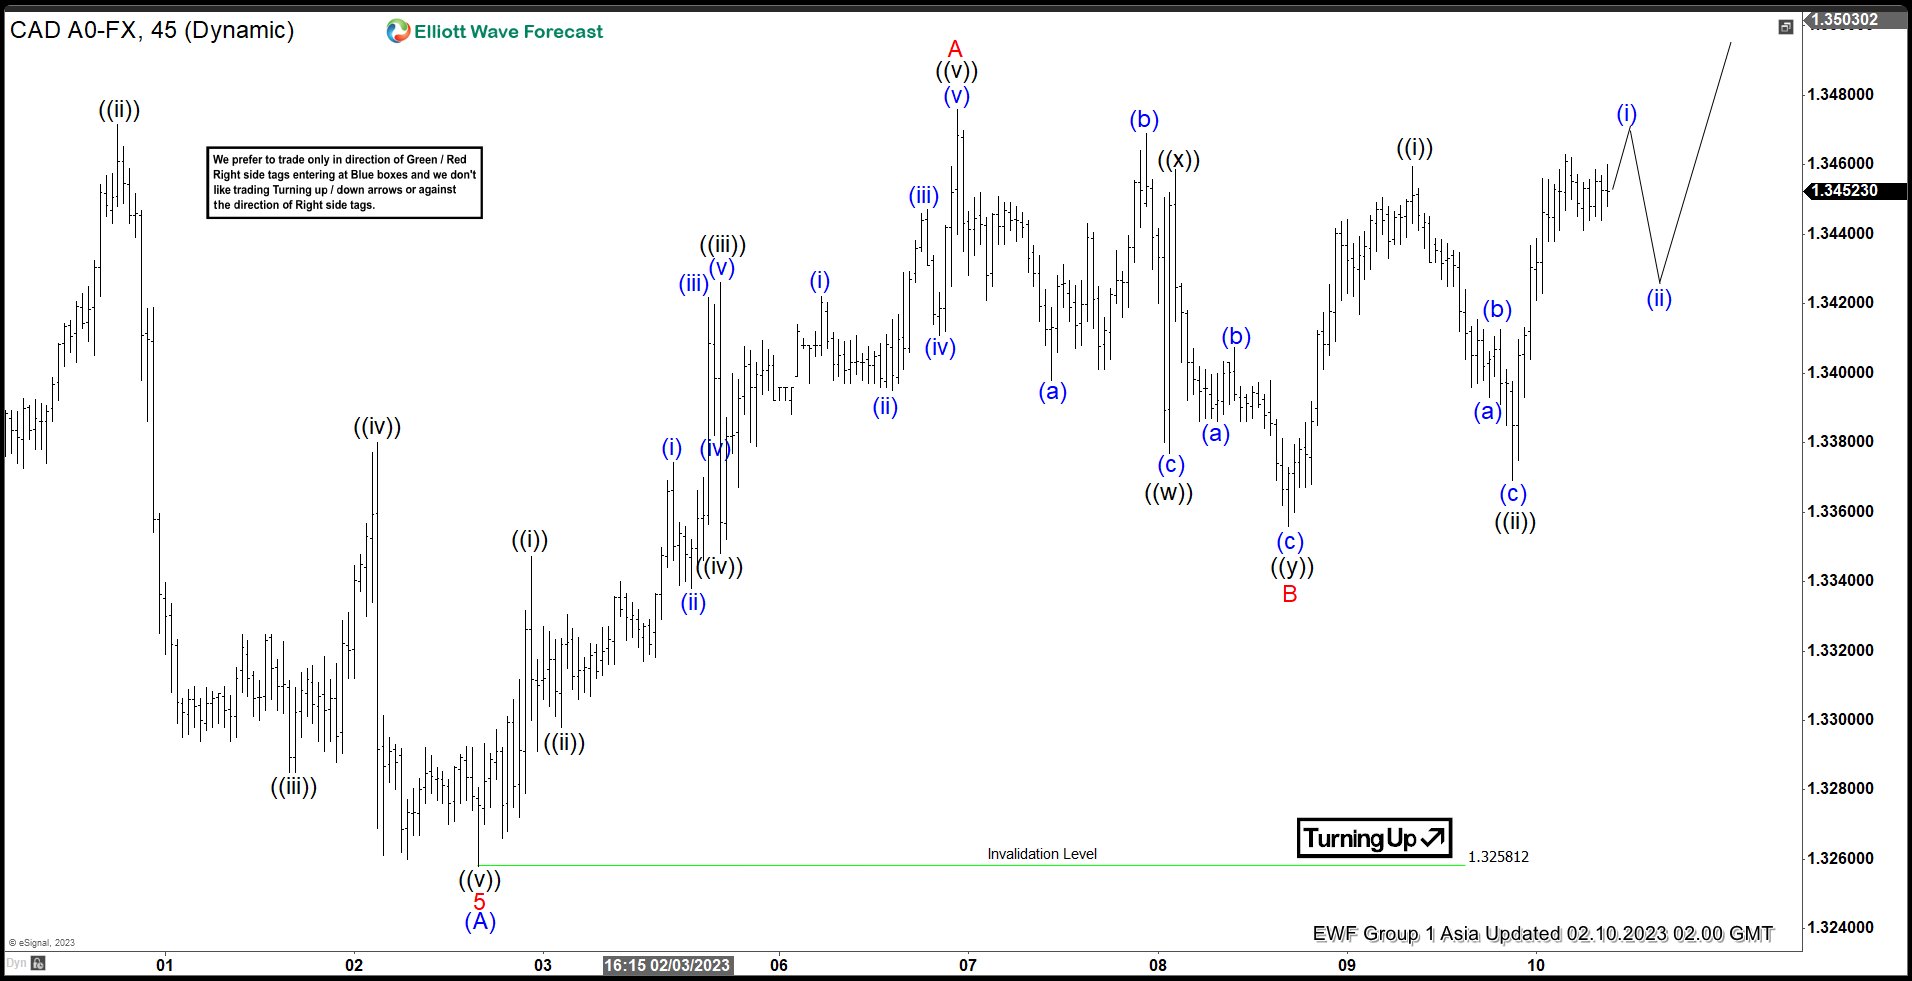
Short term Elliott Wave in USDCAD suggests the decline from 12.17.2022 high ended at 1.3258 as wave (A). Down from 12.17.2022 peak, wave 1 ended at 1.348 and rally in wave 2 ended at 1.3685. Pair extends lower again in wave 3 towards 1.3318 and bounce in wave 4 ended at 1.352. Final leg lower wave 5 ended at 1.3258 which completed wave (A). Wave (B) rally is currently in progress with internal subdivision as a zigzag Elliott Wave structure.
Up from 2.2.2023 low, wave ((i)) ended at 1.3347 and dips in wave ((ii)) ended at 1.3298. Pair extends higher in wave ((iii)) towards 1.3426, and pullback in wave ((iv)) ended at 1.3352. Final leg wave ((v)) ended at 1.3475 which completed wave A in higher degree. Pullback in wave B unfolded as a double three Elliott Wave structure and ended at 1.3356. Down from wave A, wave ((w)) ended at 1.337 and wave ((x)) ended at 1.3458. The third leg wave ((y)) ended at 1.3356 which completed wave B. Pair has turned higher in wave C but still needs to break above wave A at 1.3475 to rule out a double correction. Up from wave B, wave ((i)) ended at 1.3459 and dips in wave ((ii)) ended at 1.3369. Near term, as far as pivot at 1.3258 stays intact, expect pair to extend higher.


