New Zealand Dollar (NZDUSD) rallied on Friday last week and Monday this week and managed to make a new high above 0.6914 peak. Let’s take a look at some charts from members area to see how our members were prepared for this move and knew the area from where this rally was expected to take place.
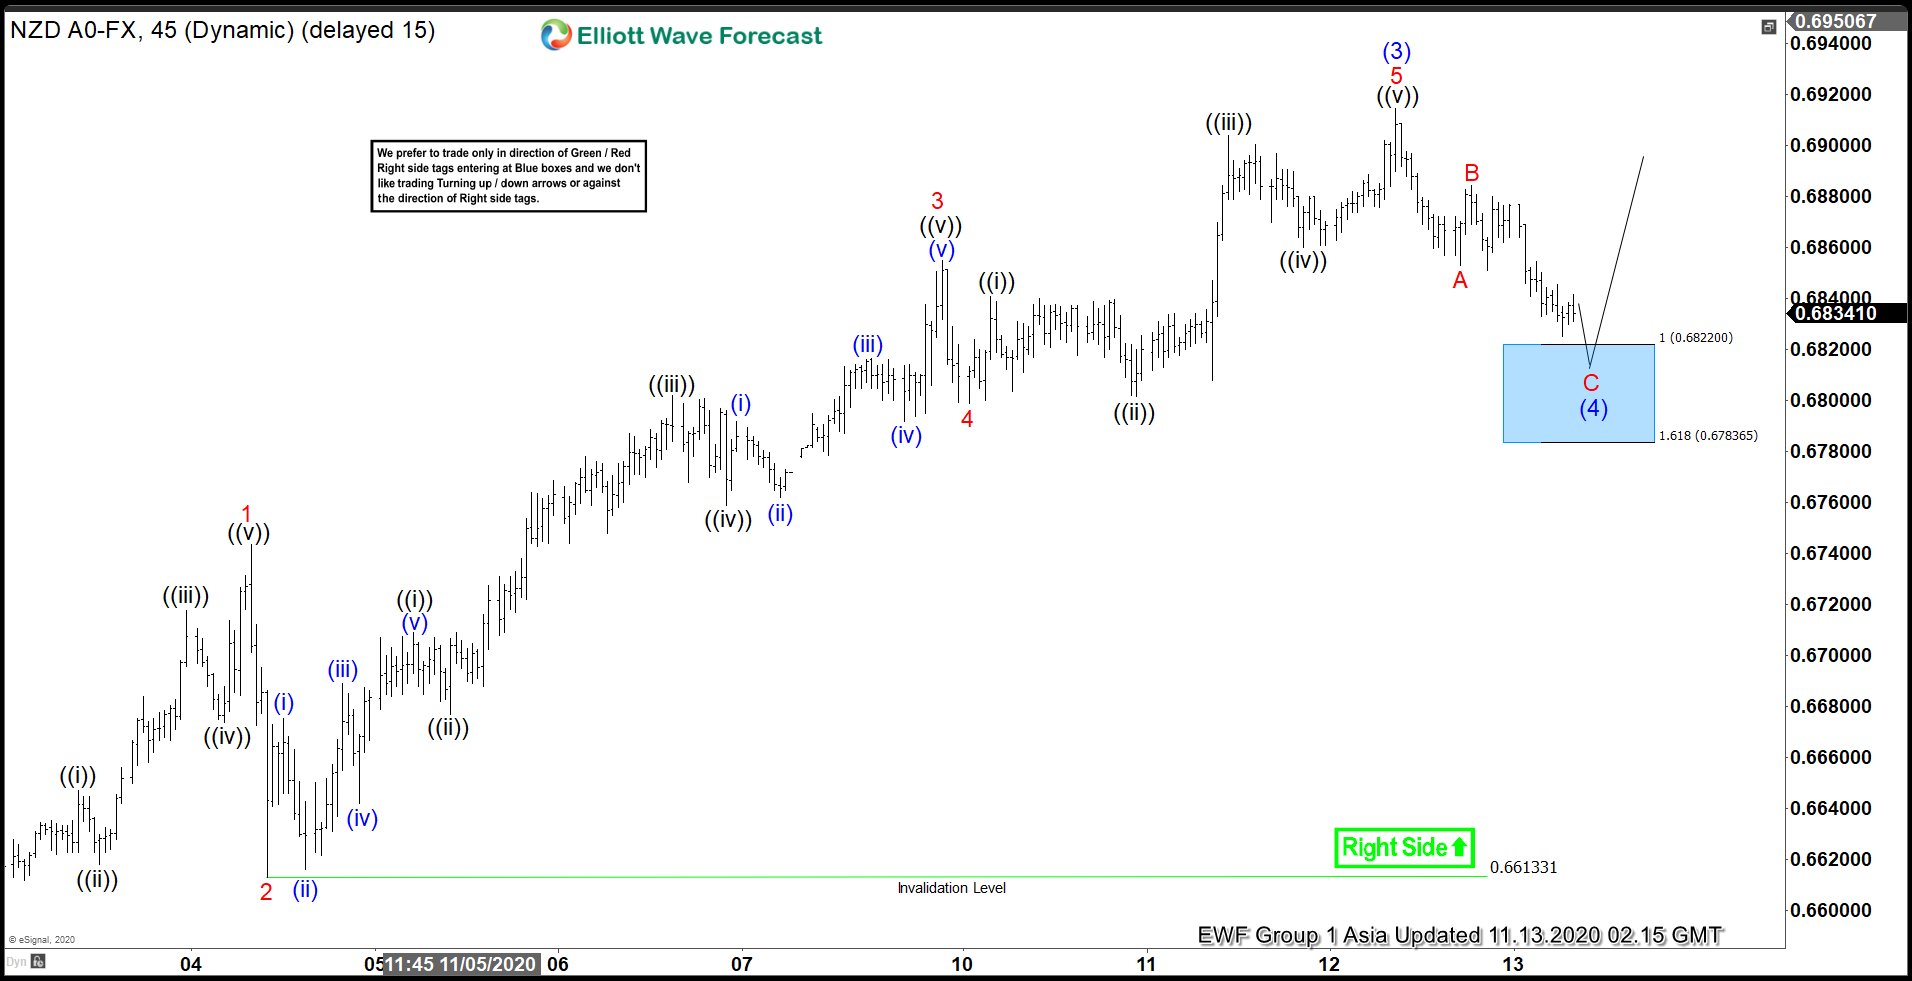
NZDUSD 1 Hour Elliott Wave Analysis 13 November
Chart below shows an impulsive rally is in progress when wave 1 of (3) completed at 0.6743, wave 2 of (3) completed at 0.6612, wave 3 of (3) completed at 0.6855, wave 4 of (3) completed at 0.6799 and wave 5 of (3) completed at 0.6914. Following this, pair started wave (4) pull back which is unfolding as a Zigzag Elliottwave Structure and is expected to complete between 0.6822 – 0.6783 area. We have highlighted this area with a blue box, blue boxes are high-frequency areas which are based in a relationship of sequences, cycles and calculated using extensions. In blue box areas, both buyers and sellers agree in direction of the next move for 3 swings at least and hence we also call these blue boxes the no-enemy areas. We expected the rally to resume in wave (5) from this blue box area or a 3 waves bounce at least to take place to allow any buyers entering in blue box to get into a risk free position.
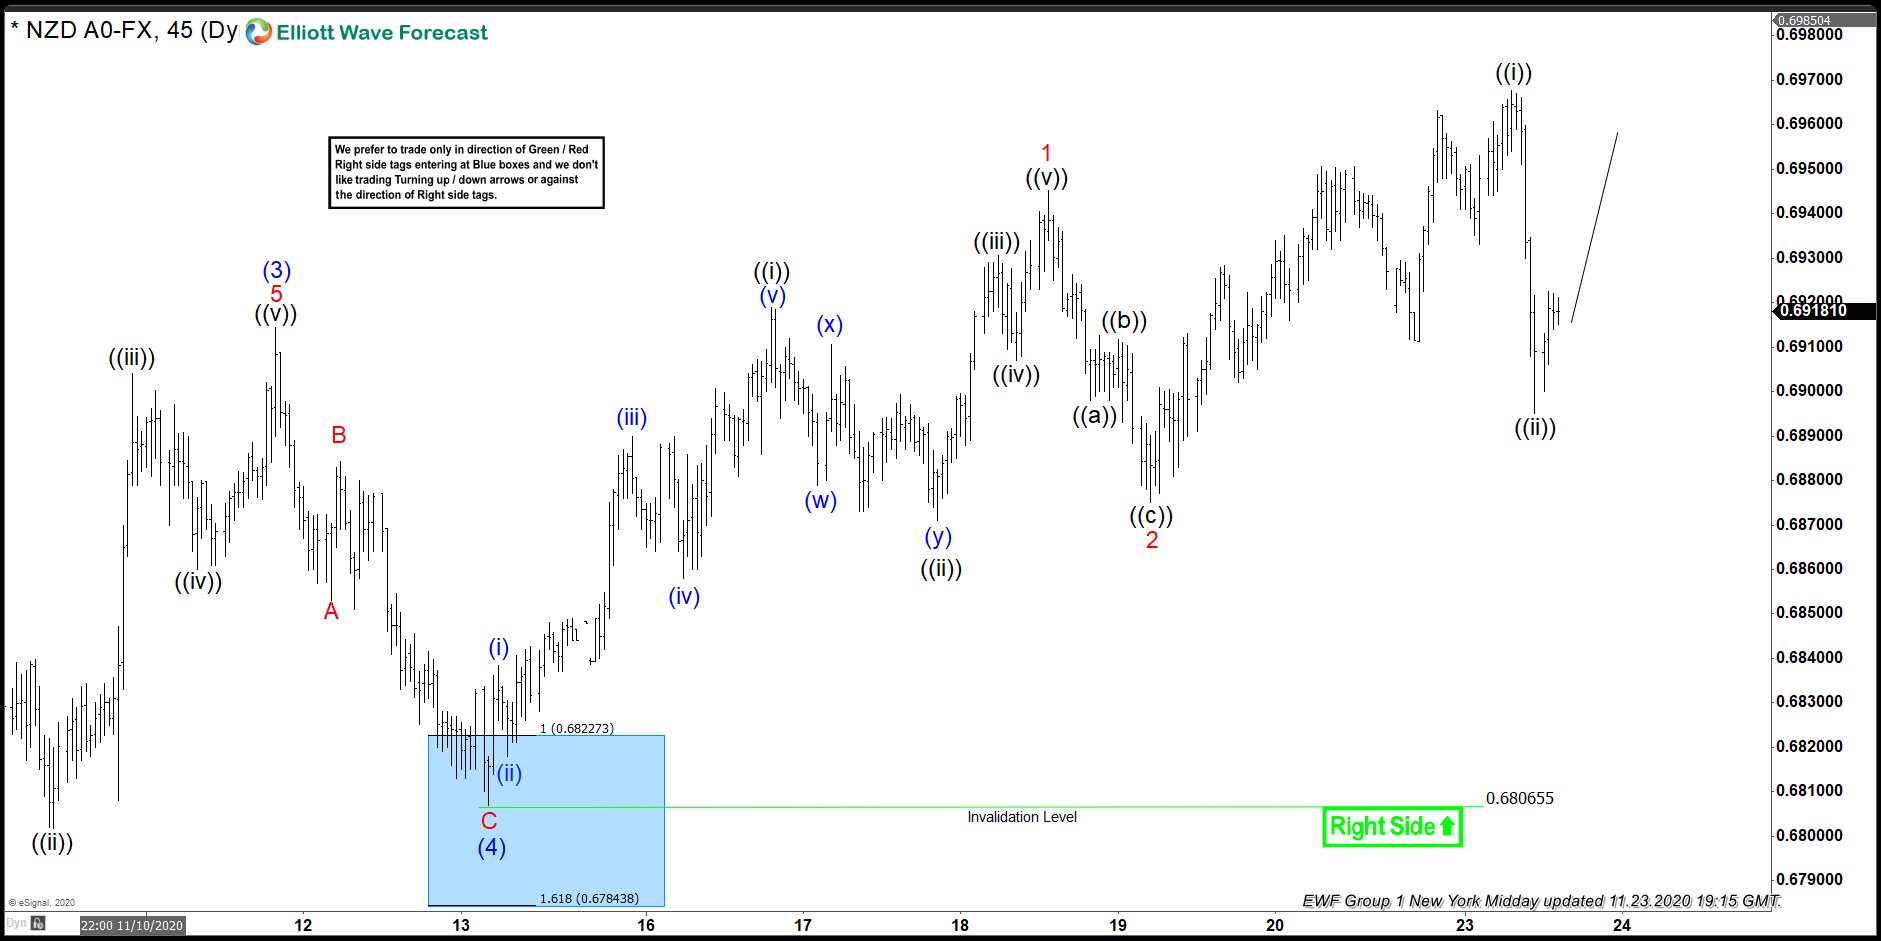
NZDUSD 1 Hour Elliott Wave Analysis 11.23.2020
NZDUSD found buyers in blue box and rallied to a new high as expected and wave (5) remains in progress. Pair is currently showing 3 swings up from wave (4) low which means more upside should take place within wave (5). 0.6942 – 0.6984 is inverse 123.6 – 161.8% Fibonacci extension area and has already been reached but as pair is only showing 3 swings up from blue (4) low, wave (5) should still see more upside. Next area of interest would be 0.7024 – 0.7075 which is 100 – 123.6% extension of wave (1) projected higher from wave (4) low.
Back


