Hello fellow traders. In this technical blog we’re going to take a quick look at the Elliott Wave charts of 10 Year Notes ( $ZN_F) . As our members know, ZN_F has given us recovery against the 135’17 peak- wave ((4)). Once we got the signs that turn is ready to happen, we label cycle from the June 14th low completed at the 122’015 peak. Since then, we are calling for a decline in the price of 10 Year Notes. In the further text we are going to explain the Elliott Wave Forecast.
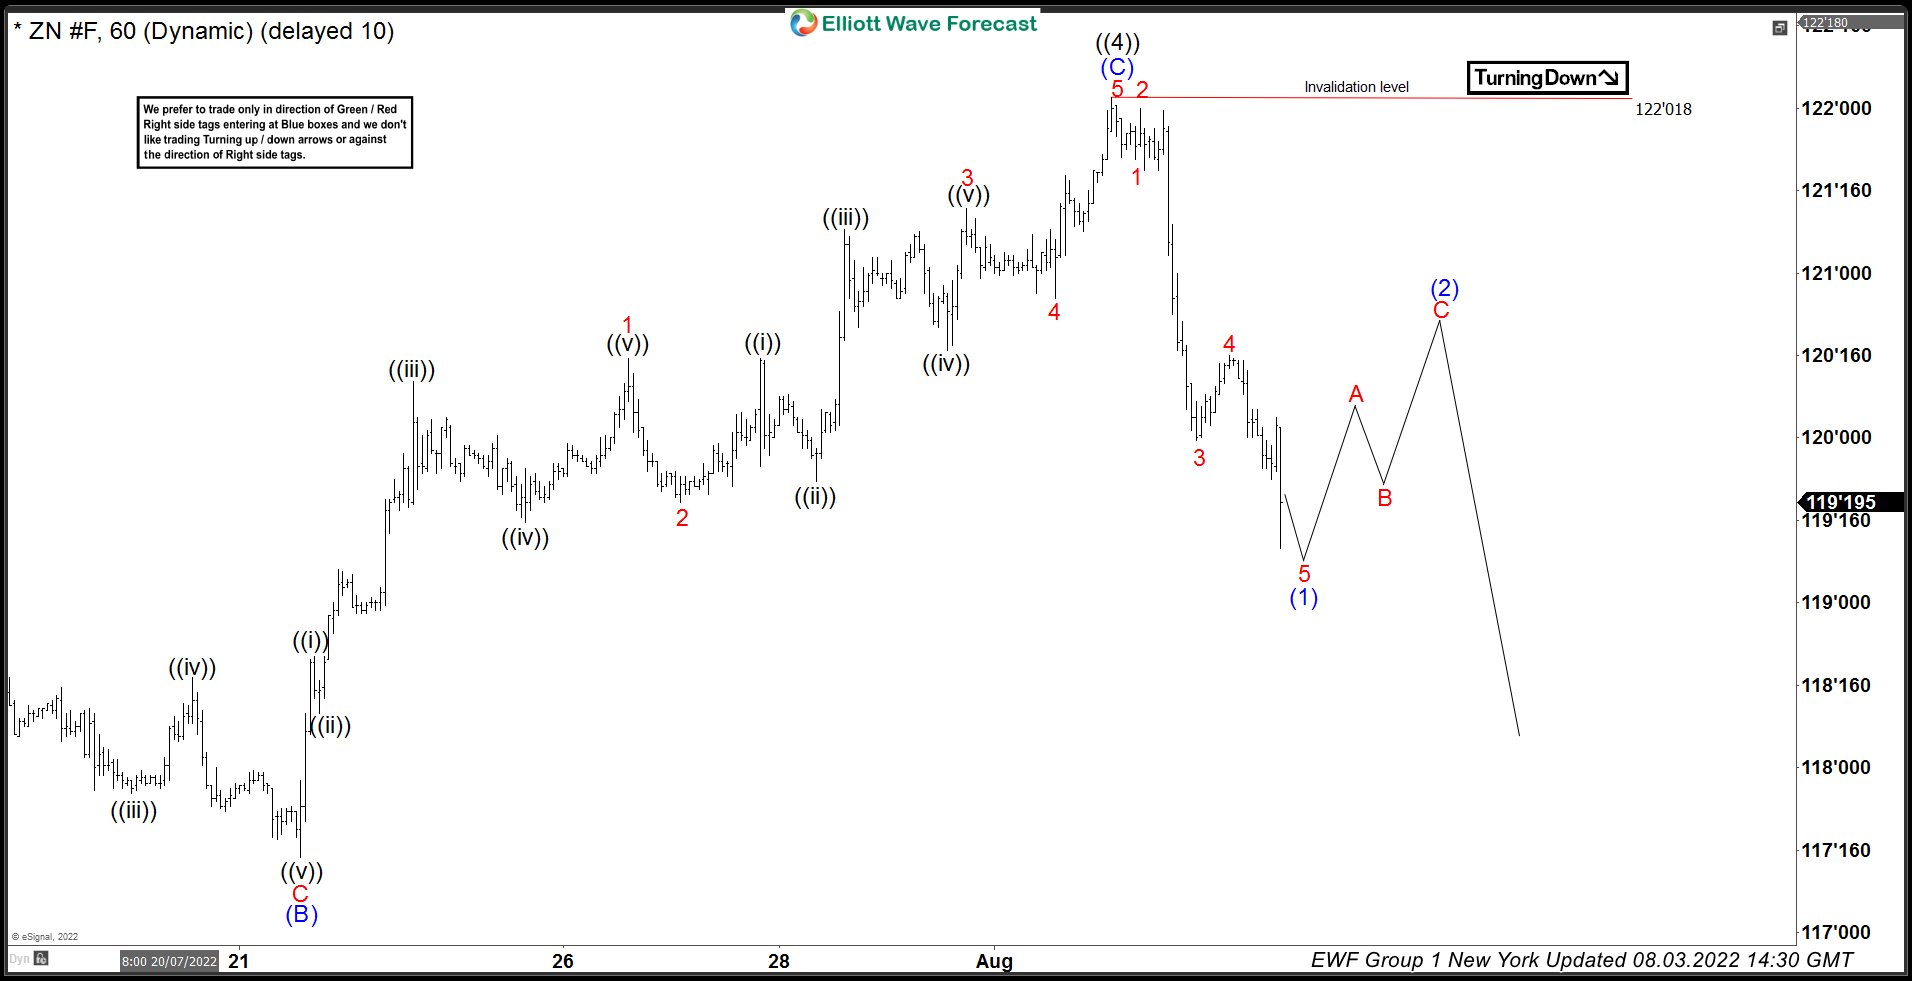
10 Year Notes ( $ZN_F) H1 Elliott Wave Analysis 08.03.2022
10 Year Notes is showing clear 3 waves up in the cycle from the June low. At this stage we are calling June cycle completed at 122’028 peak as wave ((4)). Decline from the mentioned high shows clear 5 waves structure, suggesting new cycle has begun. We expect to see 3 waves bounce in wave (2) blue, that will correct the drop from the 122’018 peak. Once (2) blue completes, the price should ideally continue trading lower again.
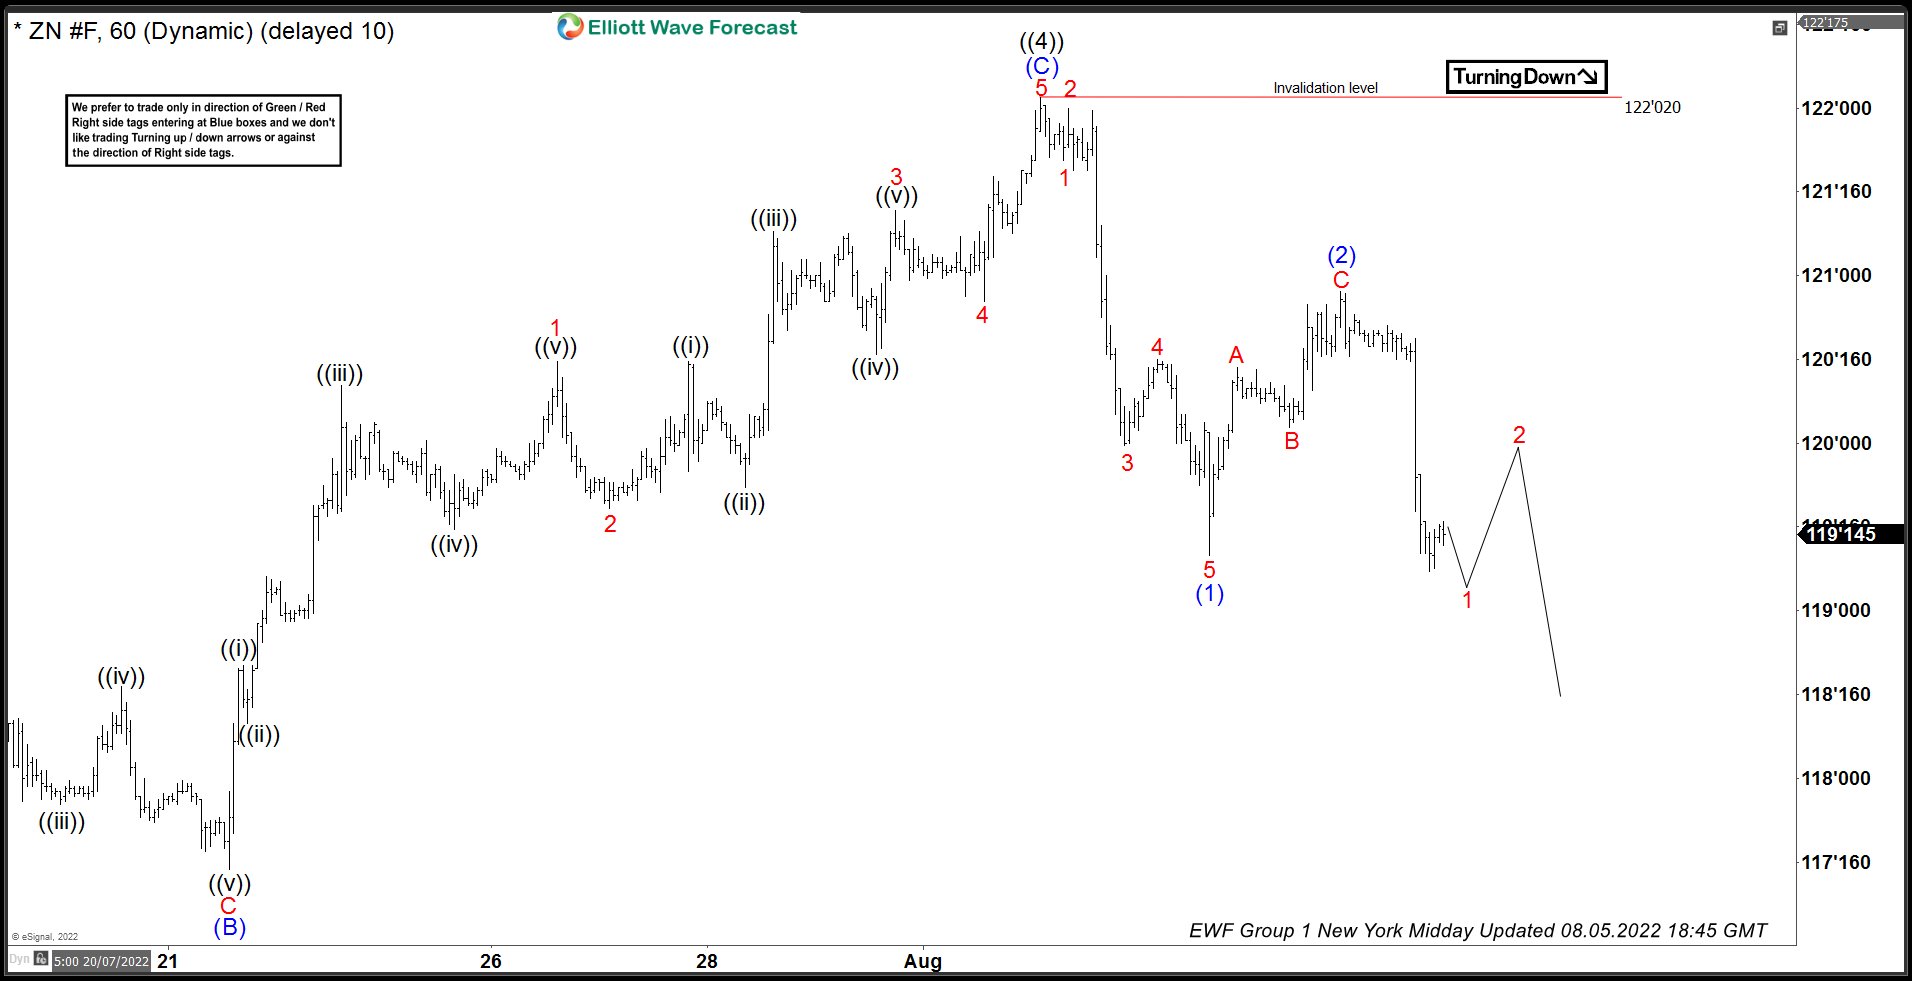
10 Year Notes ( $ZN_F) H1 Elliott Wave Analysis 08.05.2022
ZN_F made 3 waves up in (2) blue, that ended at 120’29 as truncated ABC zig zag. We got sharp decline toward new lows, breaking below previous (1) blue low. That break confirmed next leg down is in progress and ZN_F now remains bearish against the 120’29 high . Considering the price is in wave (3) now, we are targeting 118’07-116’17 at least.
Reminder: You can learn more about Elliott Wave Rules and Patterns at our Free Elliott Wave Educational Web Page.
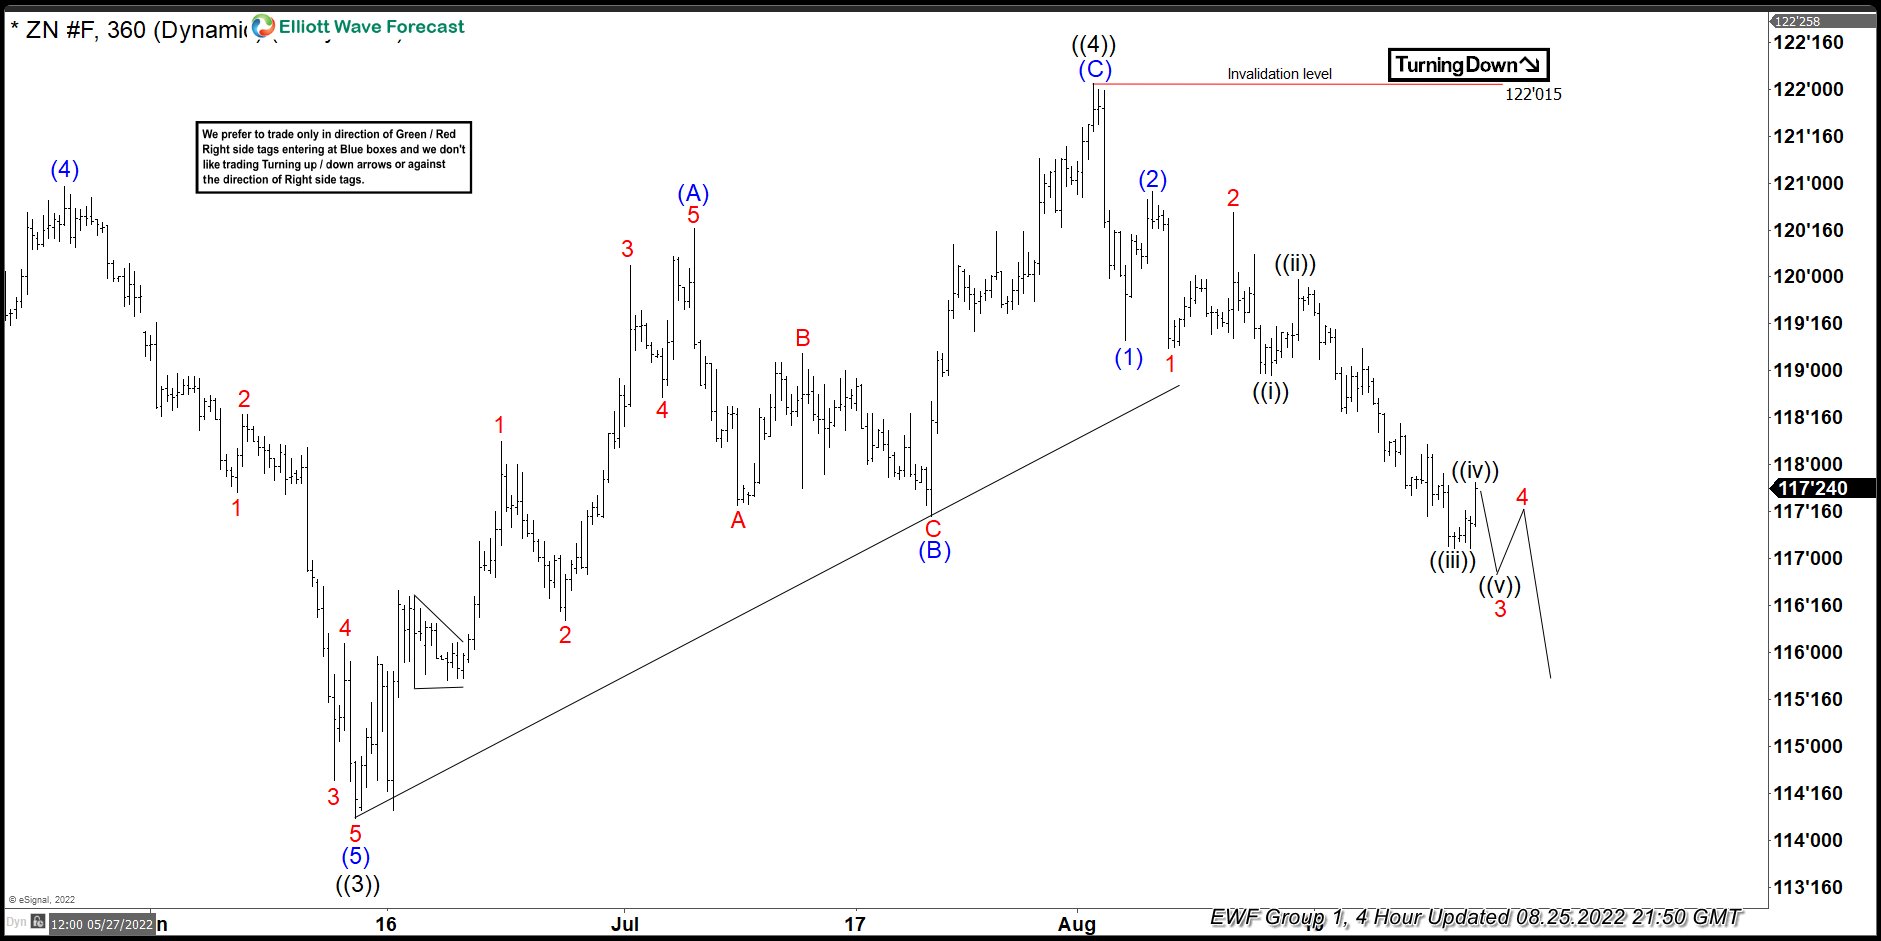
10 Year Notes ( $ZN_F) H4 Elliott Wave Analysis 08.25.2022
After 2 weeks of trading sideways to lower 10 year notes has finally reached our target zone at 118’07-116’17. At the chart below you can see what inner Elliott Wave labeling for wave (3) blue looks like.
Keep in mind market is dynamic and presented view could have changed in the mean time. You can check most recent charts in the membership area of the site. Please keep in mind that now every chart is trading recommendation. Best instruments to trade are those having incomplete bullish or bearish swings sequences.We put them in Sequence Report and best among them are shown in the Live Trading Room.
Elliott Wave Forecast
We cover 78 instruments in total, but not every chart is trading recommendation. We present Official Trading Recommendations in Live Trading Room. If not a member yet, Sign Up for 14 days Trial now and get access to new trading opportunities. Through time we have developed a very respectable trading strategy which defines Entry, Stop Loss and Take Profit levels with high accuracy.
Welcome to Elliott Wave Forecast !


