Platinum is one of the major precious metal commodities, along with gold, silver and palladium. As one of the least reactive materials, it is a noble metal which is highly appreciated and used in jewelry. The main functionality, however, remains within the industrial applications such as vehicle emmisions control devices, chemical production and petrol refining, electrical and biomedical applications accounting for about 2/3 of all platinum implementations.
Platinum Monthly Elliott Wave Analysis 10.18.2020
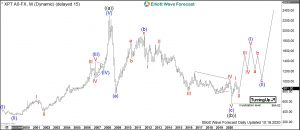
The monthly chart below shows the platinum spot price in US dollars: XPTUSD. From the all-time lows, the commodity price has developed a cycle higher in wave ((a)). It has ended in March 2008 at 2302.0. As a matter of fact, it has peaked before gold and silver which have found their highs later in 2011. Back those days, the ounce price of platinum was higher than that of gold making it the most expensive precious metal.
From the all-time highs in 2008, a correction lower in wave ((b)) has unfolded as an Elliott Wave zigzag pattern. In 12 years, platinum has lost 3/4 of the price and has reached 564.82 level. It is the preferred view that an important bottom on March 2020 has been set and the wave ((b)) has ended. From the lows, the recovery does match with the price action in silver which is also turning up for another leg higher in wave ((c)) of grand super cycle degree.
For 2020-2030, the expectations are to break out to new all-time highs together with silver and gold. The target for wave ((c)) to end will be 2860-4278 area.
Platinum Weekly Elliott Wave Analysis 10.18.2020
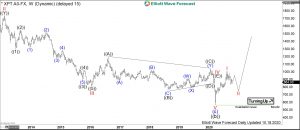
The weekly chart below shows the last stages of the blue wave (c) of black wave ((b)) lower. One can see a triangle in wave IV of (c) resolving in a thrust lower in red wave V to end the larger cycle. Thereafter, platinum shows signs of a recovery. Correlation to other metals like copper and silver supports the bullish view. Platinum should be already within the first stages of a new cycle in wave ((c)).
Platinum Daily Elliott Wave Analysis 10.18.2020
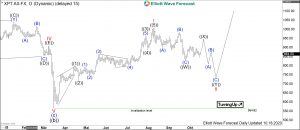
The daily chart below shows in more detail the advance. From the March 2020 lows at 564.82, red wave I has ended in August 2020 at 1009.58 highs. Within the impulsive advance in wave I, the internals ((1)), ((3)) and ((5)) are all motive waves. From the August highs, a correction lower in wave II may be still in progress. It can develop a double three pattern being a 3-3-3 structure. Alternatively, the pullback in wave II may be complete at 830.43 lows. While above there, XPTUSD could be already extending higher in wave III.
Based on correlation to other metals, pullbacks should find support in 3, 7 or 11 swings above March 2020 lows at 564.82. In a long run, platinum should reach 2860-4278 area. Hereby, investors obtain a great opportunity to partcuipate in rising commodity prices.
Get more insights about Commodities by trying out our services 14 days . You’ll learn how to trade the market in the right side using the 3, 7 or 11 swings sequence. You will get access to our 78 instruments updated in 4 different time frames, Live Trading & Analysis Session done by our Expert Analysts every day, 24-hour chat room support and much more.
Back


