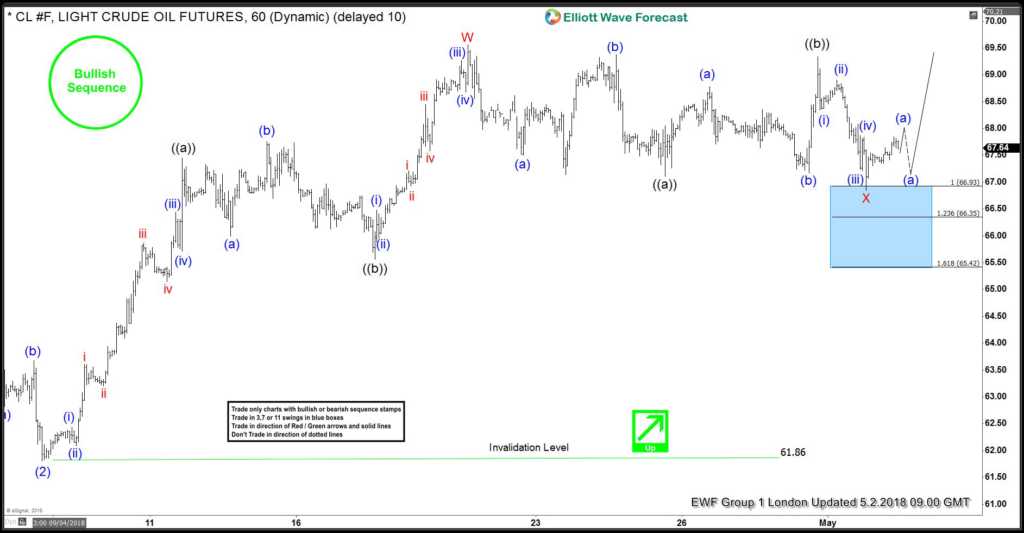
In this blog, I want to share some short-term Elliott Wave charts of Crude Oil which we presented to our members in the past. Below, you see the 1-hour updated chart presented to our clients on the 05/02/18 calling for more upside after ending the correction to the cycle from 09/04/18 in an Elliott Wave Flat correction in black ((a))-((b)).
Oil ended the cycle from 09/04 low, at the high of around 69.60 (04/19 peak) in red wave W. Up from there, it started a pullback to correct the cycle from 09/04/18. The pullback unfolded as a flat structure in black wave ((a))-((b)). Due to the bullish sequence stamp, we advised members that the right side remains to the upside. Therefore, we suggested members buying Oil at the equal legs of 66.93-65.42. You can see in the chart, that oil already bounced higher from that area. Therefore, we went with the more aggressive view, in calling the correction in red wave X completed.
Crude Oil 05.02.2018 1 Hour Chart Elliott Wave Analysis
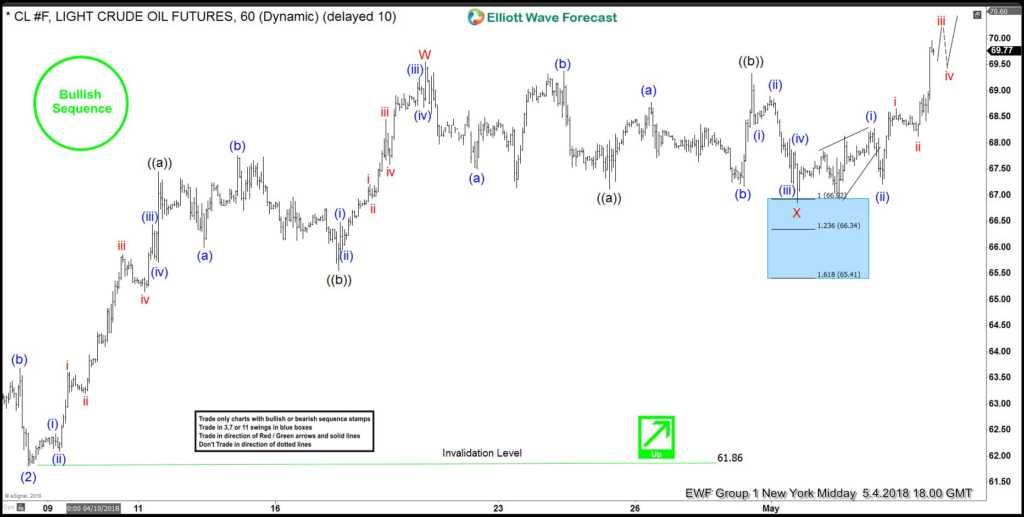
In the last Elliott Wave chart, you can see that Oil rallied to the upside, confirming that red wave X was in place. The rally is currently unfolding as 5 waves impulsive from 05/01/18 low. So any trade from the equal legs 66.93-65.42 areas should be risk-free by now, targeting higher levels. As long as the market stays above 66.87, it should continue its rally.
Crude Oil 05.04.2018 1 Hour Chart Elliott Wave Analysis
I hope you enjoyed this blog and I wish you all good trades and if you interested in learning more about our unique blue box areas. You can join for FREE to a 14 days Trial below.
We believe in cycles, distribution, and many other tools in addition to the classic or new Elliott Wave Principle.
Join us today for a FREE 14 Days trial to trade our profitable blue box areas.
Back


