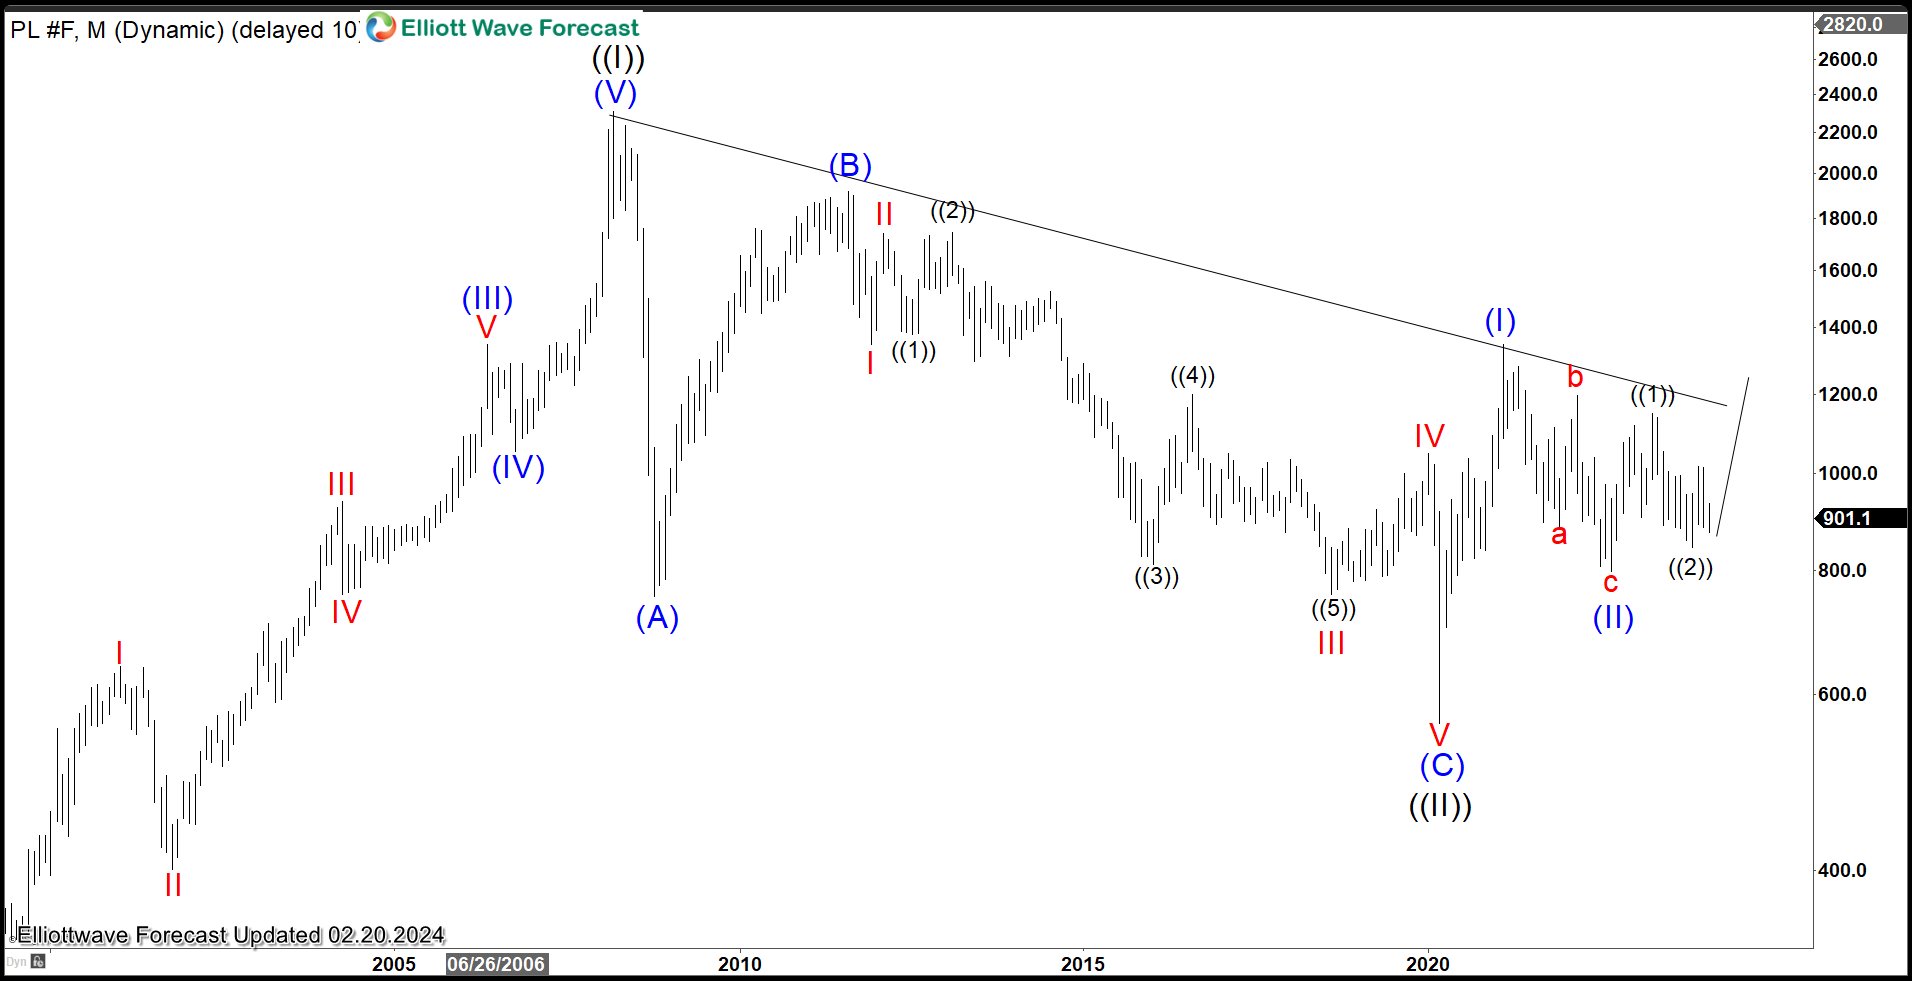
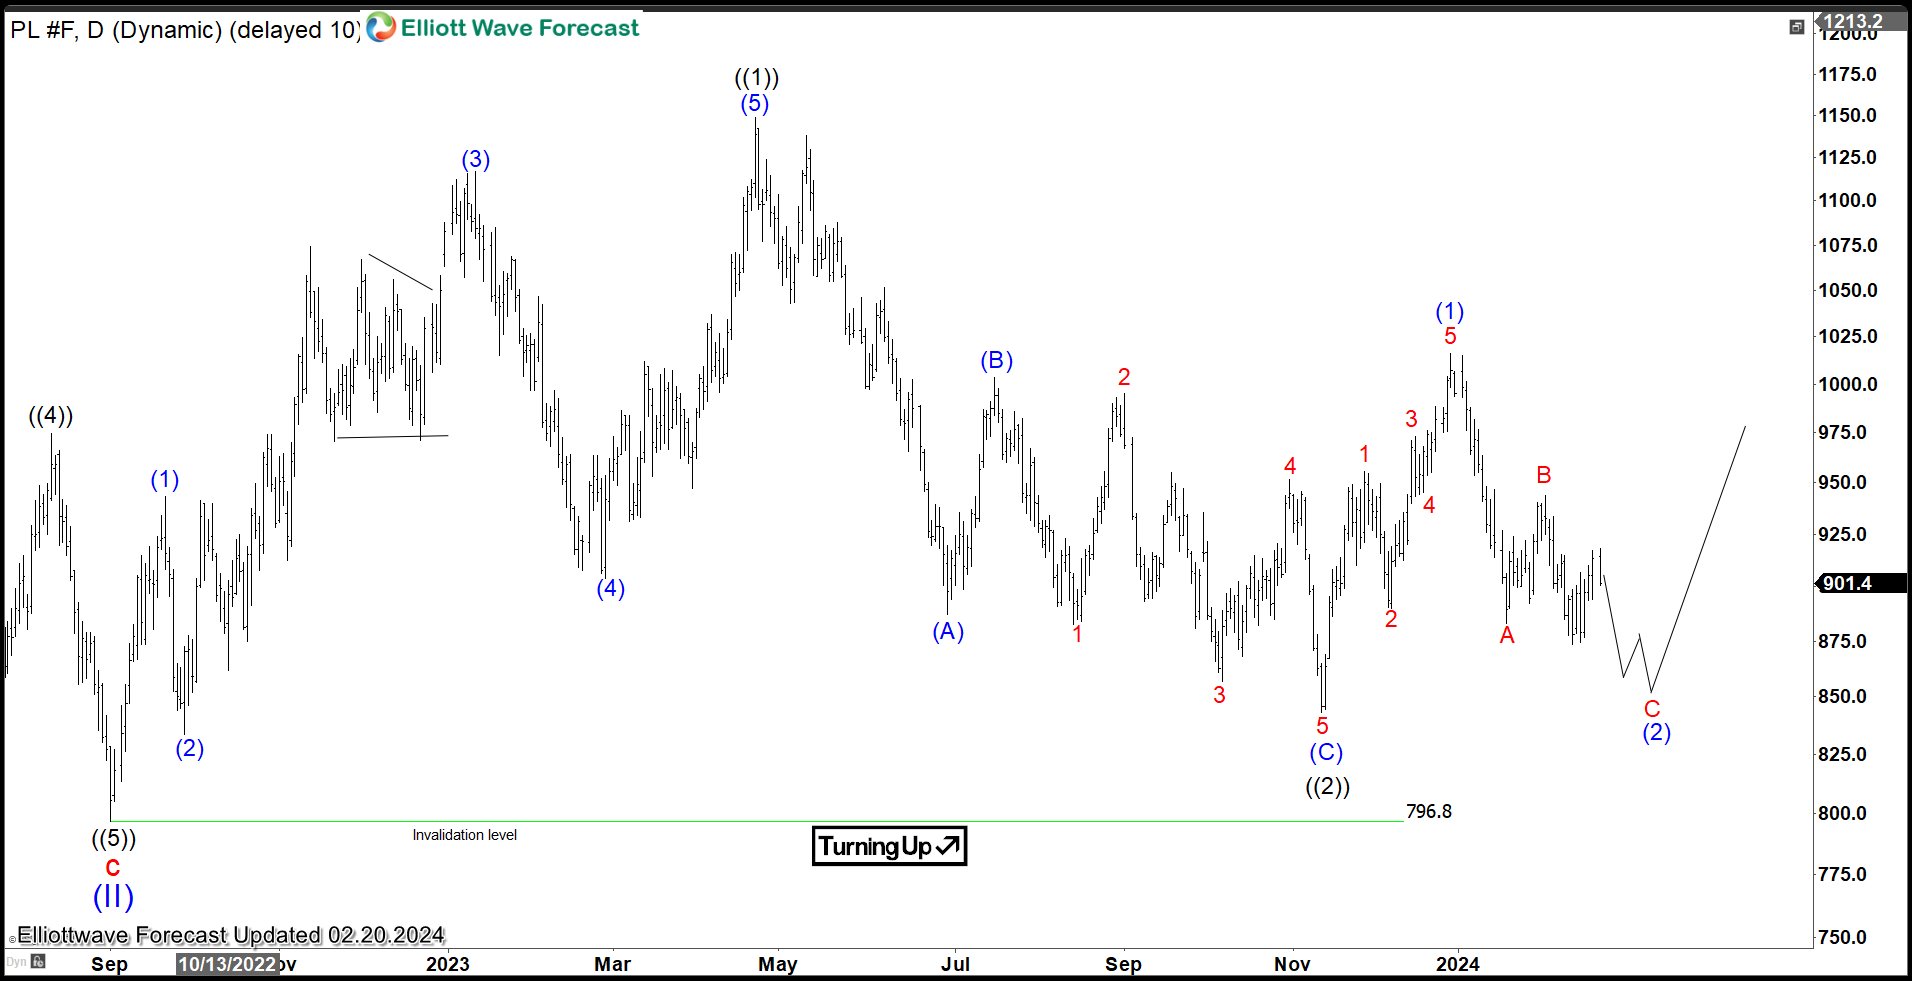
Platinum (PL) is still in the process of forming a bottom and the metal is trading sideways since 2021 peak at 1348.2. The metal still needs to break above 1348.2 to confirm that the next leg higher has started. Below we updated the Monthly and Daily Elliott Wave chart for the metal.
Platinum (PL) Monthly Elliott Wave Chart
 Monthly chart of Platinum above shows that the metal ended wave ((II)) at 562. The rally from there is in progress as a nesting impulse Wave (I) of ((III)) ended at 1348.2 and dips in wave (II) of ((III)) is proposed complete at 796.8. Up from wave (II), the metal is nesting with wave ((1)) ended at 1148.9. Dips in wave ((2)) might have ended at 843.1. While above 843.1, the metal can see further upside.
Platinum (PL) Daily Elliott Wave Chart
Daily chart of Platinum above shows that the metal ended wave (II) at 796.8. Up from wave (II), wave ((1)) ended at 1148.9 and wave ((2)) pullback ended at 843.1. It is then nesting higher with wave (1) ended at 1016. Near term, while above 796.8, expect the metal to extend higher.
If you’d like to get regular Elliott Wave technical updates for various commodities, stock market and forex, you can sign up with our trial here –> 14 days Trial
Back

