With tense geopolitical situation between two world super powers, ongoing war, and banking crisis, there’s no shortage of black swan events. Gold and Silver have performed very well in this environment. After 3 years of consolidation, they look to have formed major low earlier this year and ready for the next bullish cycle. We will look at the Gold-to-Silver ratio (AUG) which has an inverse correlation to the underlying physical Gold and Silver. In other words, when the ratio is going higher, both Gold and Silver go down. Conversely, when the ratio turns lower, both Gold and Silver go up in price. In both cases, Silver outperforms Gold in upside as well as downside. Let’s see the latest daily outlook of AUG below.
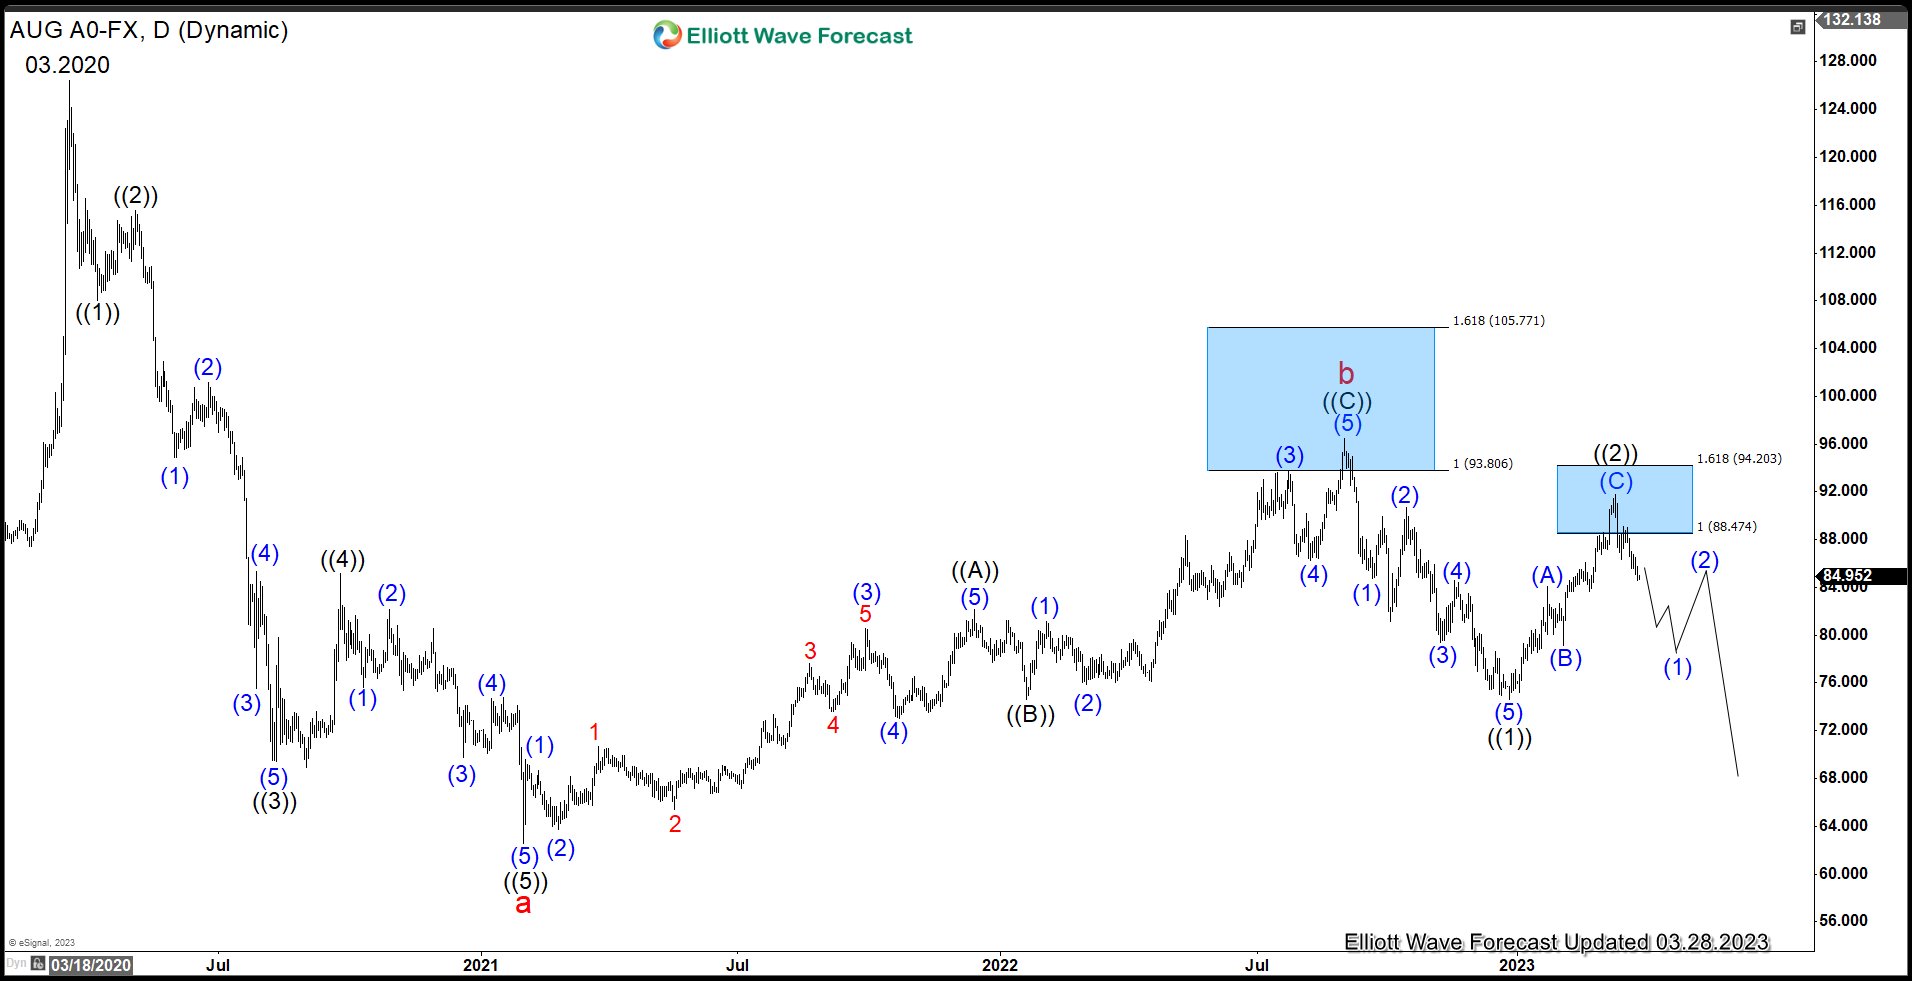
Gold to Silver Ratio Daily Chart
Gold-to-Silver ratio (AUG) daily chart above shows the decline from March 2020 high is in 5 waves impulse and ended wave a at 62.51. It then did a 3 waves zigzag corrective rally. Up from wave a, wave ((A)) ended at 82.13 and pullback in wave ((B)) ended at 74.65. Last leg wave ((C)) ended at 96.49 which completed wave b. It completed the corrective rally at the 100% – 161.8% fibonacci extension of wave ((A)).
The ratio has turned lower in wave C. Down from wave b, wave ((1)) ended at 74.63. Corrective rally in wave ((2)) has also ended at 91.81 as a 3 swing zigzag. It ended the correction also at the extreme blue box area. The ratio has turned lower and we should expect it to continue lower in months to come.
If you like this analysis, take our 14 days FREE trial by clicking here –> risk free trial and see the next path for XAUUSD, XAGUSD, and other instrument in 4 time frames, live session, live trading room, 24 hour chat room, and much more.
Back

