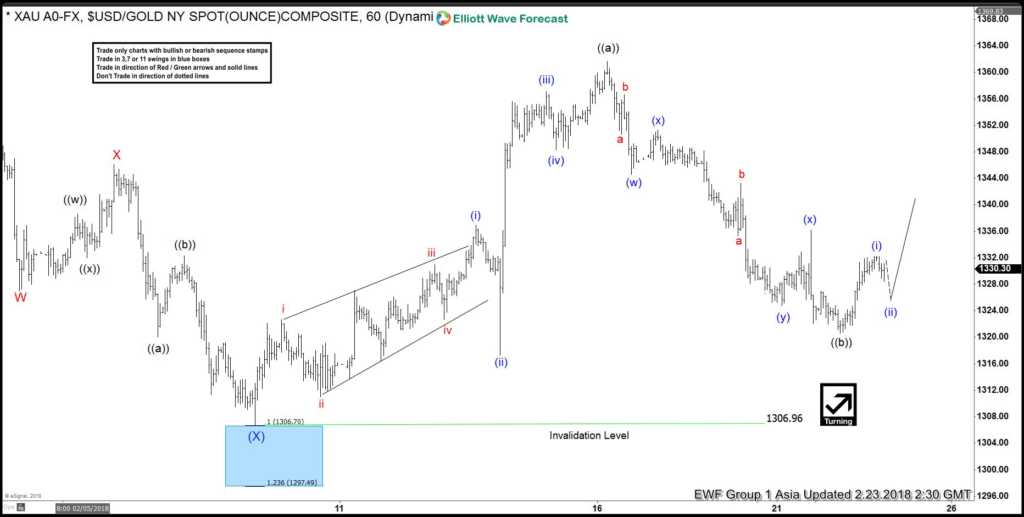
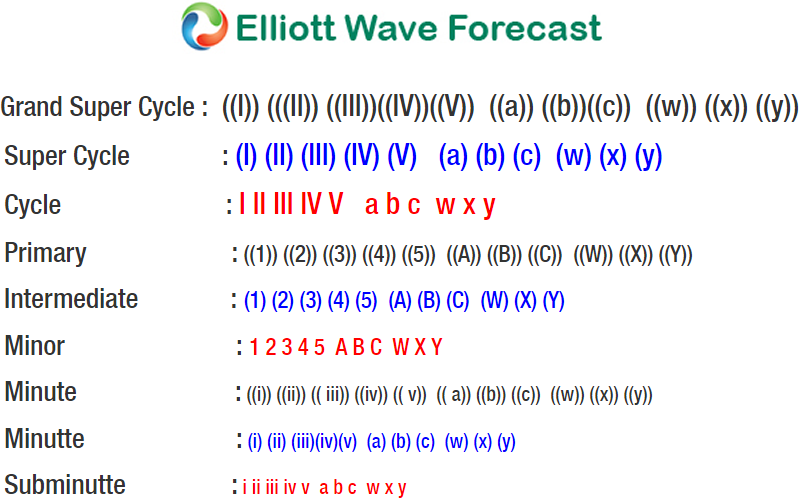
We revise our Gold Short Term Elliott Wave view to a more aggressive one and call the decline to 2.8.2018 at $1306.8 ending Intermediate wave (X). For this view to get validity however, the yellow metal needs to break above Intermediate wave (W) at $1366.06. Until then, the alternate view can’t be ruled out that the yellow metal can do a double correction in Intermediate wave (X) towards $1228.27 – $1302.28 before the rally resumes.
Up from $1306.8, the rally is proposed to be unfolding as a zigzag Elliott Wave structure where Minute wave ((a)) ended at $1361.72 and Minute wave ((b)) is proposed complete at $1320.60. Near term, while pullbacks stay above there, and more importantly above $1306.8, expect Gold to extend higher. We don’t like selling the yellow metal. If Gold breaks below $1306.8, then the yellow metal is doing a double correction in Intermediate wave (X) and opens extension lower towards $1228.27 – $1302.28 where buyers should appear for at least a 3 waves bounce.
Gold 1 Hour Elliott Wave Chart
We provide precise forecasts with up-to-date analysis for 78 instruments. These include Forex, Commodities, World Indices, Stocks, ETFs and Bitcoin. Our clients also have immediate access to Market Overview, Sequences Report, 1 Hour, 4 Hour, Daily & Weekly Wave Counts. In addition, we also provide Daily & Weekend Technical Videos, Live Screen Sharing Sessions, Live Trading Rooms and Chat room where clients get live updates and answers to their questions. The guidance of ElliottWave-Forecast gives subscribers the wherewithal to position themselves for proper entry and exit in the markets. We believe our disciplined methodology and Right side system is pivotal for long-term success in trading
Back


