In this technical article we’re going to take a quick look at the Elliott Wave charts of Copper Futures HG_F, published in members area of the website. As our members know, Copper is showing impulsive bullish sequences in the cycle from the 3.6592 low. Consequently we are favoring the long positions at this stage. The commodity has recently given us a 3-wave pattern, when buyers appeared right at the equal legs zone. We are going to explain Elliott Wave forecast further in this article.
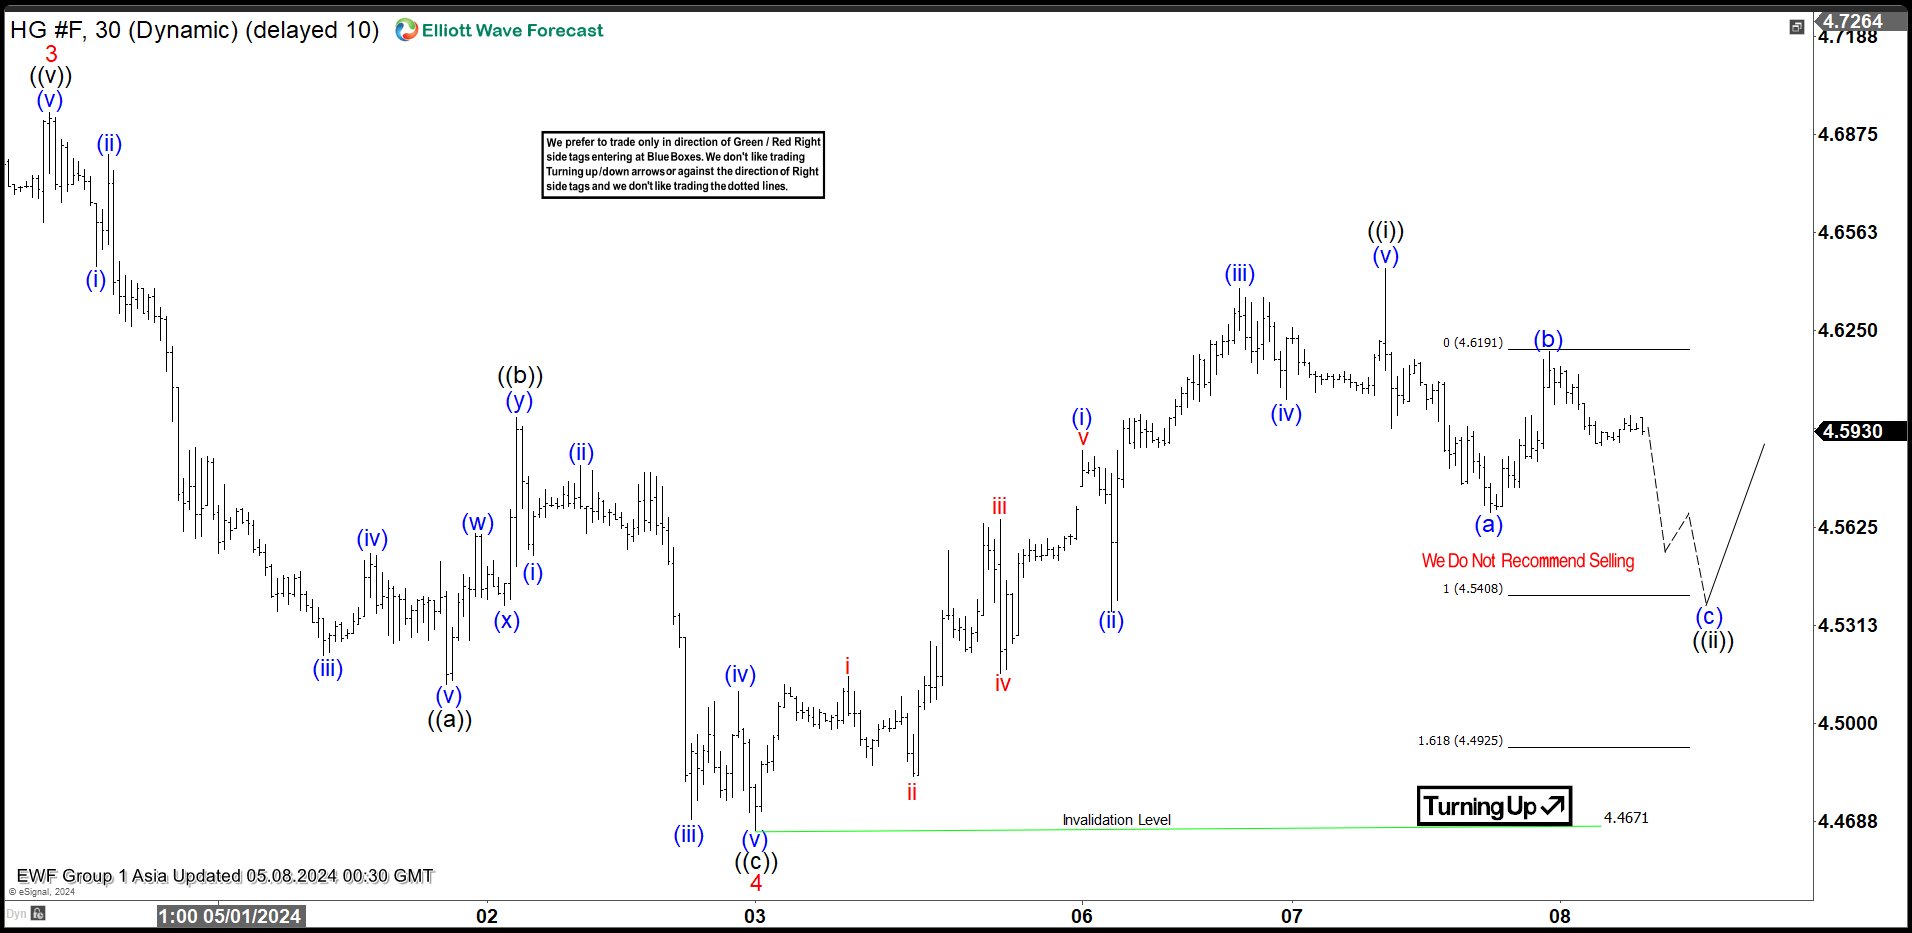
Copper H1 Asia Update 05.08.2024
The current view suggests that the Copper commodity is doing a ((ii)) black pullback, which is correcting the cycle from the 4.4671 low. So far pullback has given us 5 waves from the peak, suggesting structure is still incomplete. We expect to see another leg down toward equal legs : 4.5408-4.4925 ( buying area). Once extreme zone is reached , we expect potential buyers to appear in that area, which could lead to a further rally towards new high or a three-wave bounce at least.
Reminder : You can learn more about Elliott Wave Patterns at our Free Elliott Wave Educational Web Page.
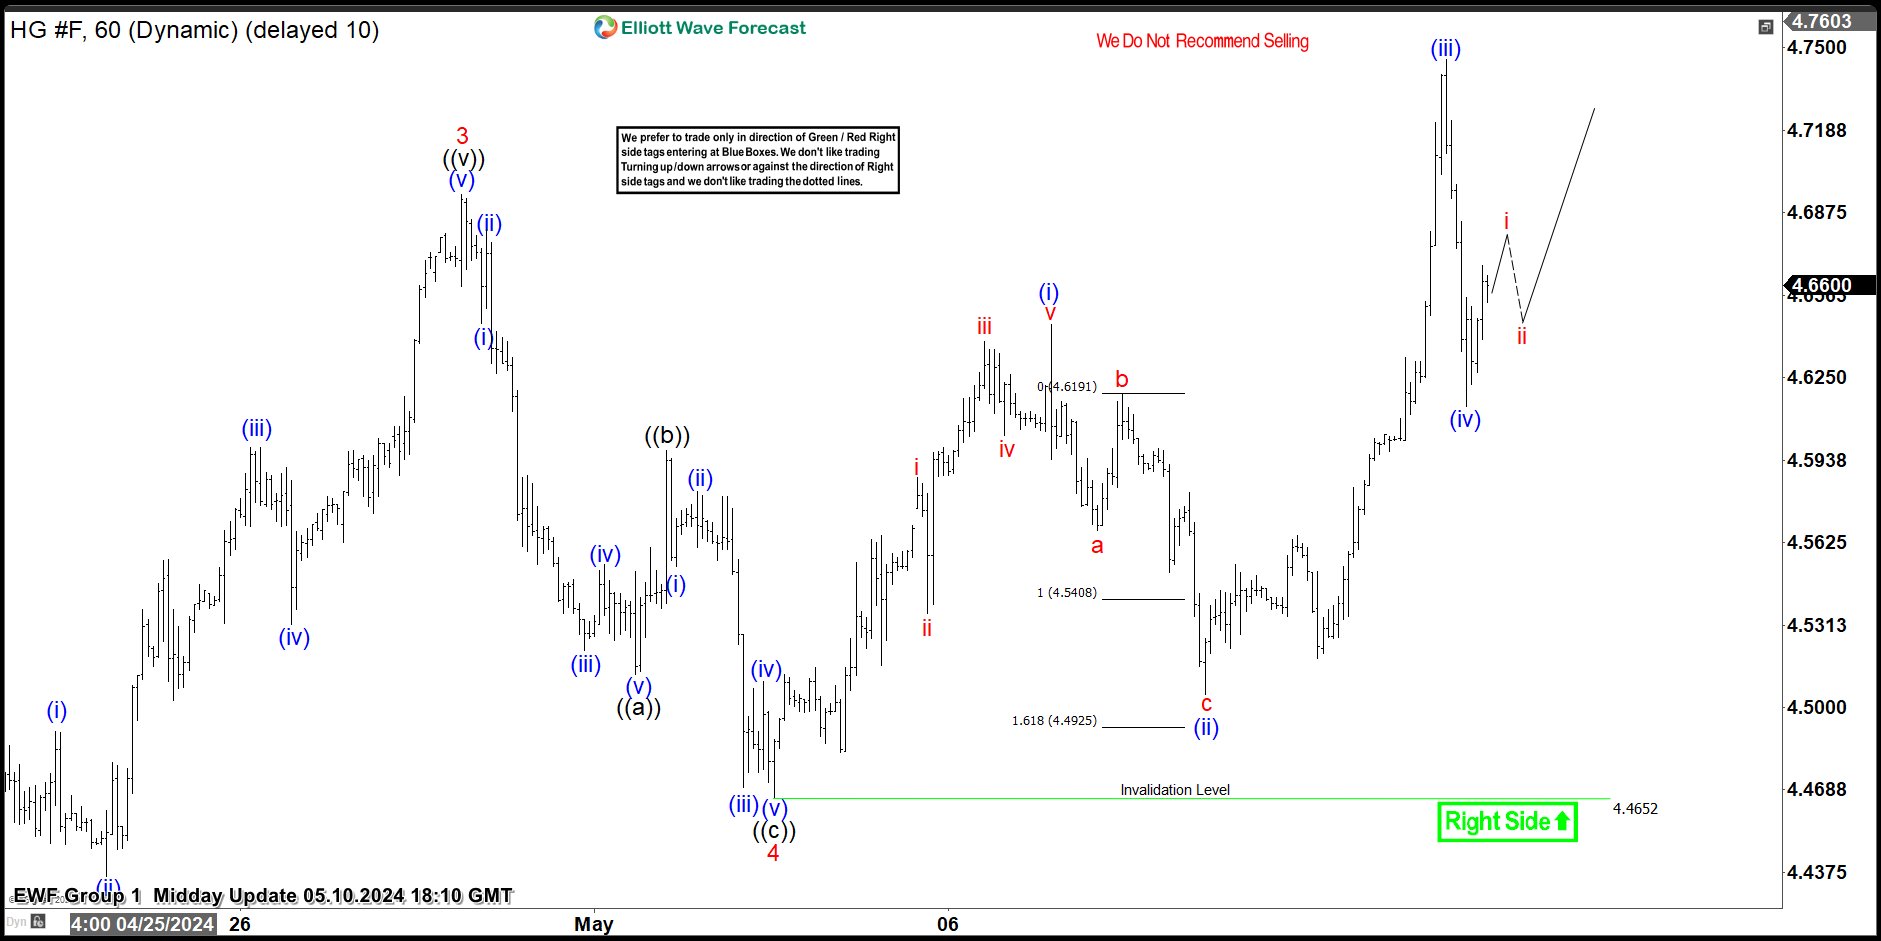
Copper H1 Midday Update 05.10.2024
The commodity made another leg down as we expected. The price has reached the extreme zone at 4.5408-4.4925 area and made a nice rally from the Equal Legs-Buyers zone, as anticipated.The commodity remains bullish against the 4.4652 pivot. We expect Copper to keep finding buyers in 3,7,11 swings as far as the mentioned pivot holds.
Remember, the market is dynamic, and the presented view may have changed in the meantime. For the most recent charts and target levels, please refer to the membership area of the site. The best instruments to trade are those with incomplete bullish or bearish swing sequences. We put them in Sequence Report and best among them are presented in the Live Trading Room
New to Elliott Wave ? Check out our Free Elliott Wave Educational Web Page and download our Free Elliott Wave Book.


