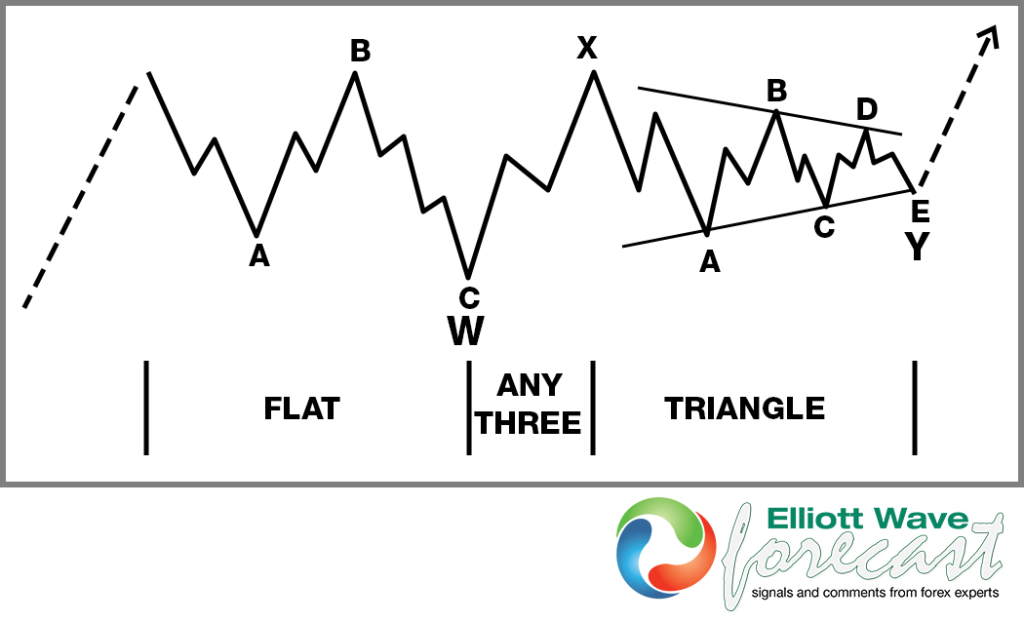
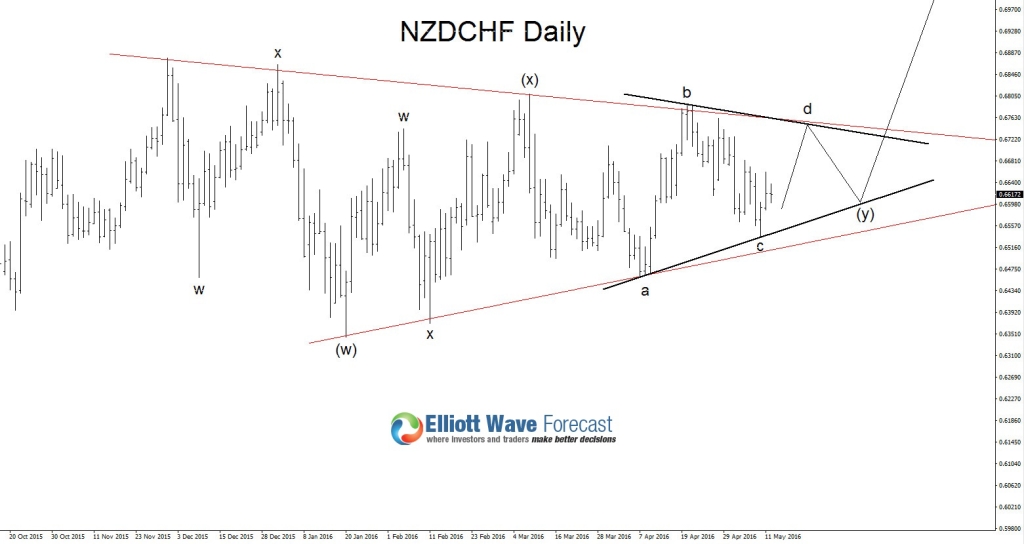
On August 24 2015 NZDCHF has bounced higher and since December 2015 it has been trading sideways stuck in a triangle structure. It now looks to be forming an Elliott Wave WXY Double Three correction pattern where we still need Wave e/(y) to terminate. Below we will show this Elliott Wave WXY Double Three correction pattern and other possible bullish patterns to indicate that NZDCHF is ready to possibly break higher in the coming days and weeks.
Elliott Wave WXY Double Three Correction Pattern
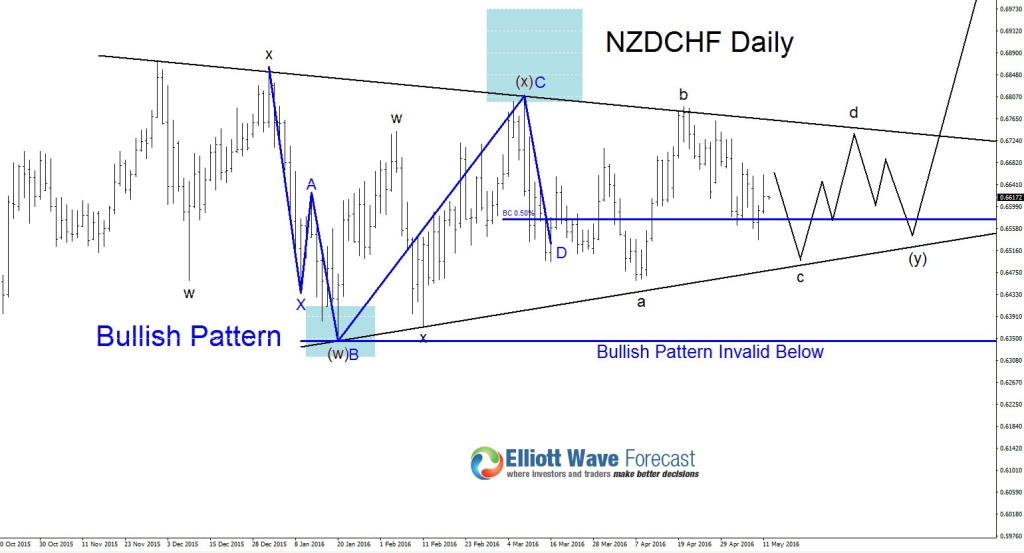
NZDCHF Bullish Pattern : Bullish pattern (Blue) BUY signal has already been triggered at the BC 0.50% Fib. retracement (0.6576) which can push price higher. This blue bullish pattern is invalidated if price moves below 0.6345.
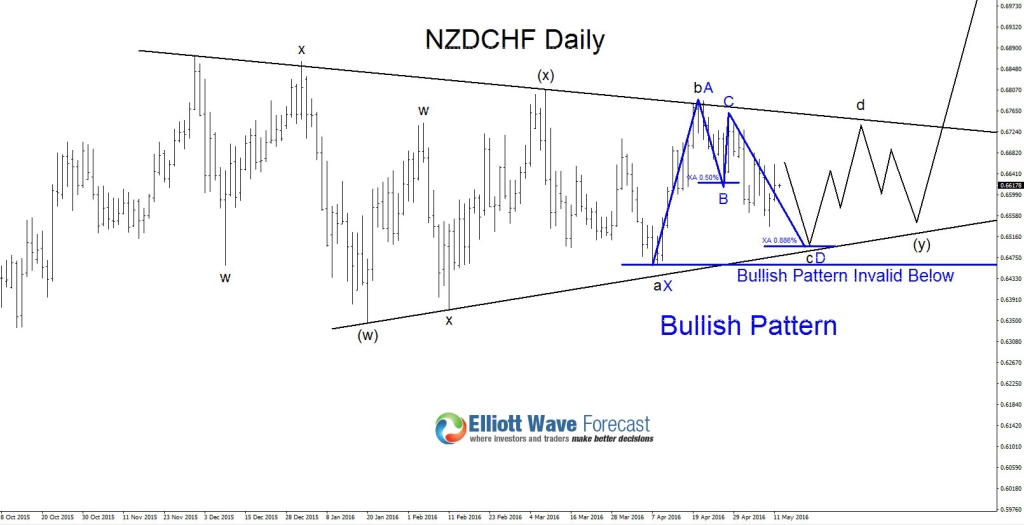
NZDCHF Possible Bullish Pattern : If price makes another push lower expect buyers to be waiting at the XA 0.886% Fib. retracement (0.6497) area. If this scenario happens it will be the best zone to buy NZDCHF in regards to risk/reward ratio. This blue bullish pattern is invalidated if price moves below blue point X at 0.6459.
As long as NZDCHF stays above Wave a low (0.6459) we expect another move higher towards the 0.7460 equal legs area. A break below Wave a low will invalidate this wave count.
If looking to buy NZDCHF stops should be placed at 0.6459 and should be bought below 0.6580 minimum for a better risk/reward trade or wait and buy on the Wave e/(y) pullback/retracement. 1st Target 0.7030 2nd Target 0.7400.
*** Always use proper risk/money management according to your account size ***
At Elliottwave-Forecast we cover 50 instruments (Forex, Commodities, Indices) in 4 different timeframes and we offer 3 Live Session Webinars everyday. We do Daily Technical Videos, Elliott Wave Trade Setup Videos and we have a 24 Chat Room. Our clients are always in the loop for the next market move.
Try Elliottwave-Forecast for 14 days FREE !!! Just click here –> 14 day FREE trial


