Hello fellow traders. In this technical article we’re going to look at the Elliott Wave charts of  SPX Index published in members area of the website. As our members know, SPX has shown incomplete bearish sequences in the cycle from the February 19th peak. The price structure indicated further weakness. In the following text, we will provide a more detailed explanation of the Elliott Wave forecast.

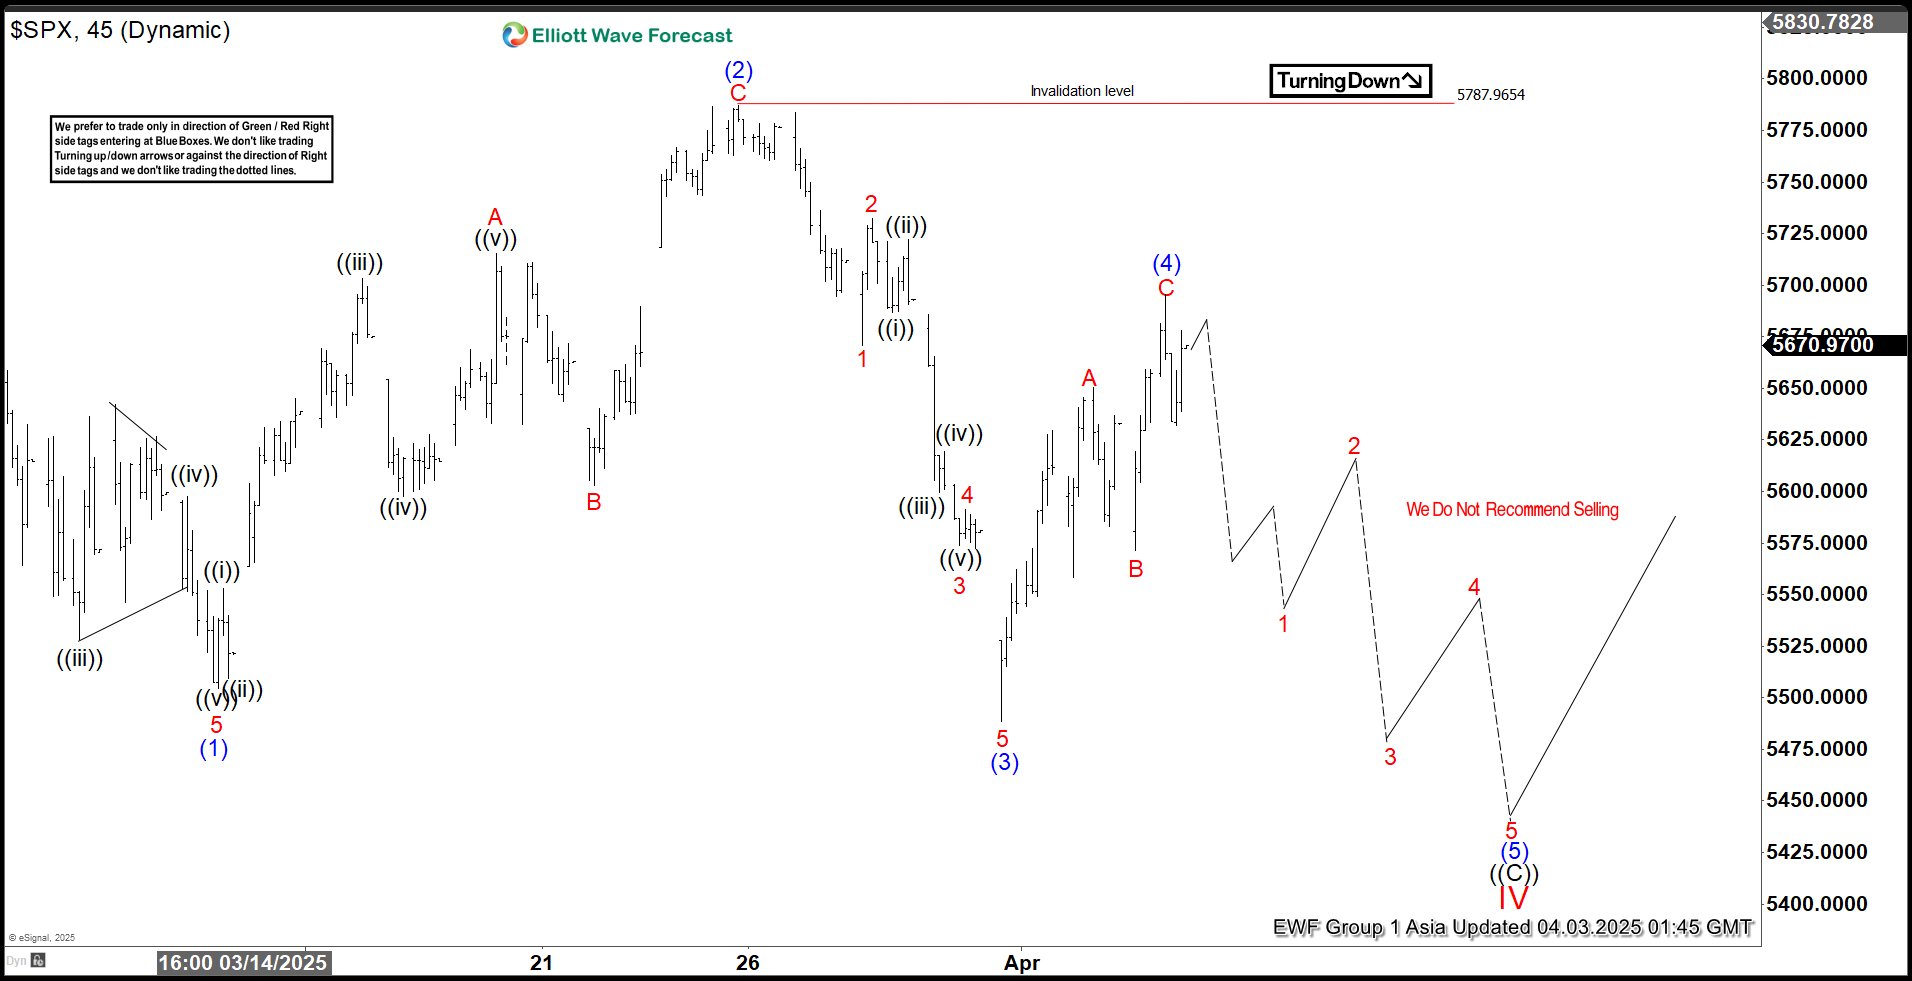
SPX 1-Hour Asia Chart Analysis: April 3, 2025

Current Elliott Wave analysis suggests that SPX has completed a three-wave recovery against the 5787.96 high, marked as wave (4) blue. As long as the price remains below the 5694 level, we consider wave (4) blue to be complete and expect continued downside in SPX towards new lows.

90% of traders fail because they don’t understand market patterns. Are you in the top 10%? Test yourself with this advanced Elliott Wave Test

SPX 1-hour Elliott Wave chart showing incomplete bearish sequences
SPX 1-hour chart showing wave (4) completion and bearish outlook

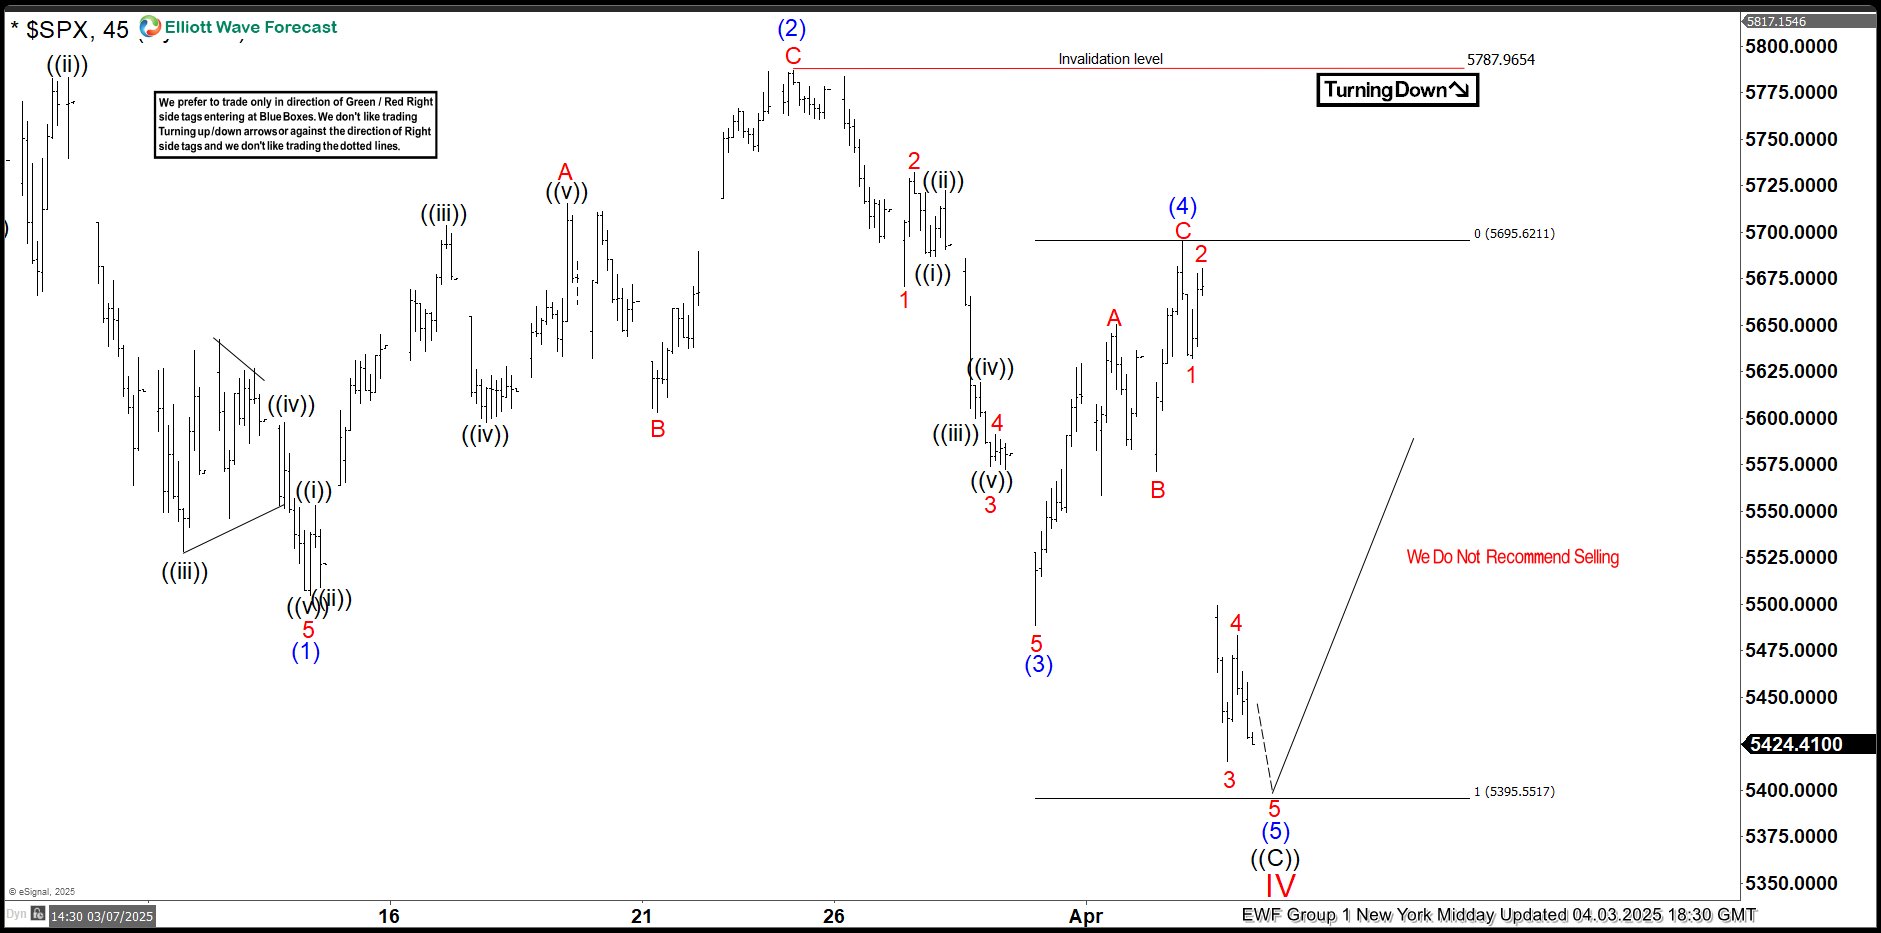
SPX 1-Hour New York Midday Chart Update: April 3, 2025

The price remained below the 5694 level, and as expected, the decline occurred. The price broke to new lows, confirming that wave (5) is in progress. We are now looking for further short-term weakness, with the next target around the 5395.55 area.

Remember, the market is dynamic, and the presented view may have changed in the meantime. For the most recent charts and target levels, please refer to the membership area of the site. The best instruments to trade are those with incomplete bullish or bearish swing sequences. We put them in Sequence Report and best among them are presented in the Live Trading Room

Reminder for members: Our chat rooms in the membership area are available 24 hours a day, providing expert insights on market trends and Elliott Wave analysis. Don’t hesitate to reach out with any questions about the market, Elliott Wave patterns, or technical analysis. We’re here to help.

SPX 1-hour midday chart confirming wave (5) progression
SPX midday chart showing breakdown to new lows confirming wave (5)

Elliott Wave Forecast Trading Services

Thank you for exploring our SPX Index Forecast with us. While we analyze 78 instruments, it’s important to remember that not every chart represents a trading recommendation. For official trading signals, we invite you to join our Live Trading Room, where we provide actionable insights in real-time. If you’re not yet a member, take advantage of our 14-day trial to unlock new trading opportunities.

Over the years, we’ve developed a reliable trading strategy that clearly defines entry, stop loss, and take profit levels. By joining us, you’ll gain access to expert guidance and the chance to refine your trading skills

Why Join Elliott Wave Forecast?

📈 Elevate your trading with Elliott Wave Forecast!

💻 Ask unlimited questions during trading hours (Monday to Friday). Our Chat Rooms are an excellent place to learn, with continuous support from our market experts!

🔍 Explore our expert insights and real-time analysis covering Forex, Indices, Commodities, Cryptocurrencies, Stocks, and ETFs across 78 instruments.

📊 Gain exclusive access to our Official Trading Recommendations in the Live Trading Room, where seasoned experts provide valuable insights and guidance on new trading opportunities.

💰 For just $9.99, unlock a wealth of knowledge and experience with our 14-day Trial. Experience firsthand our proven trading strategy, which accurately defines Entry, Stop Loss, and Take Profit levels, empowering you to make informed decisions with confidence.

👉 Ready to take the next step? Sign up now and seize the opportunity to enhance your trading performance. Click here to start your Trial today!