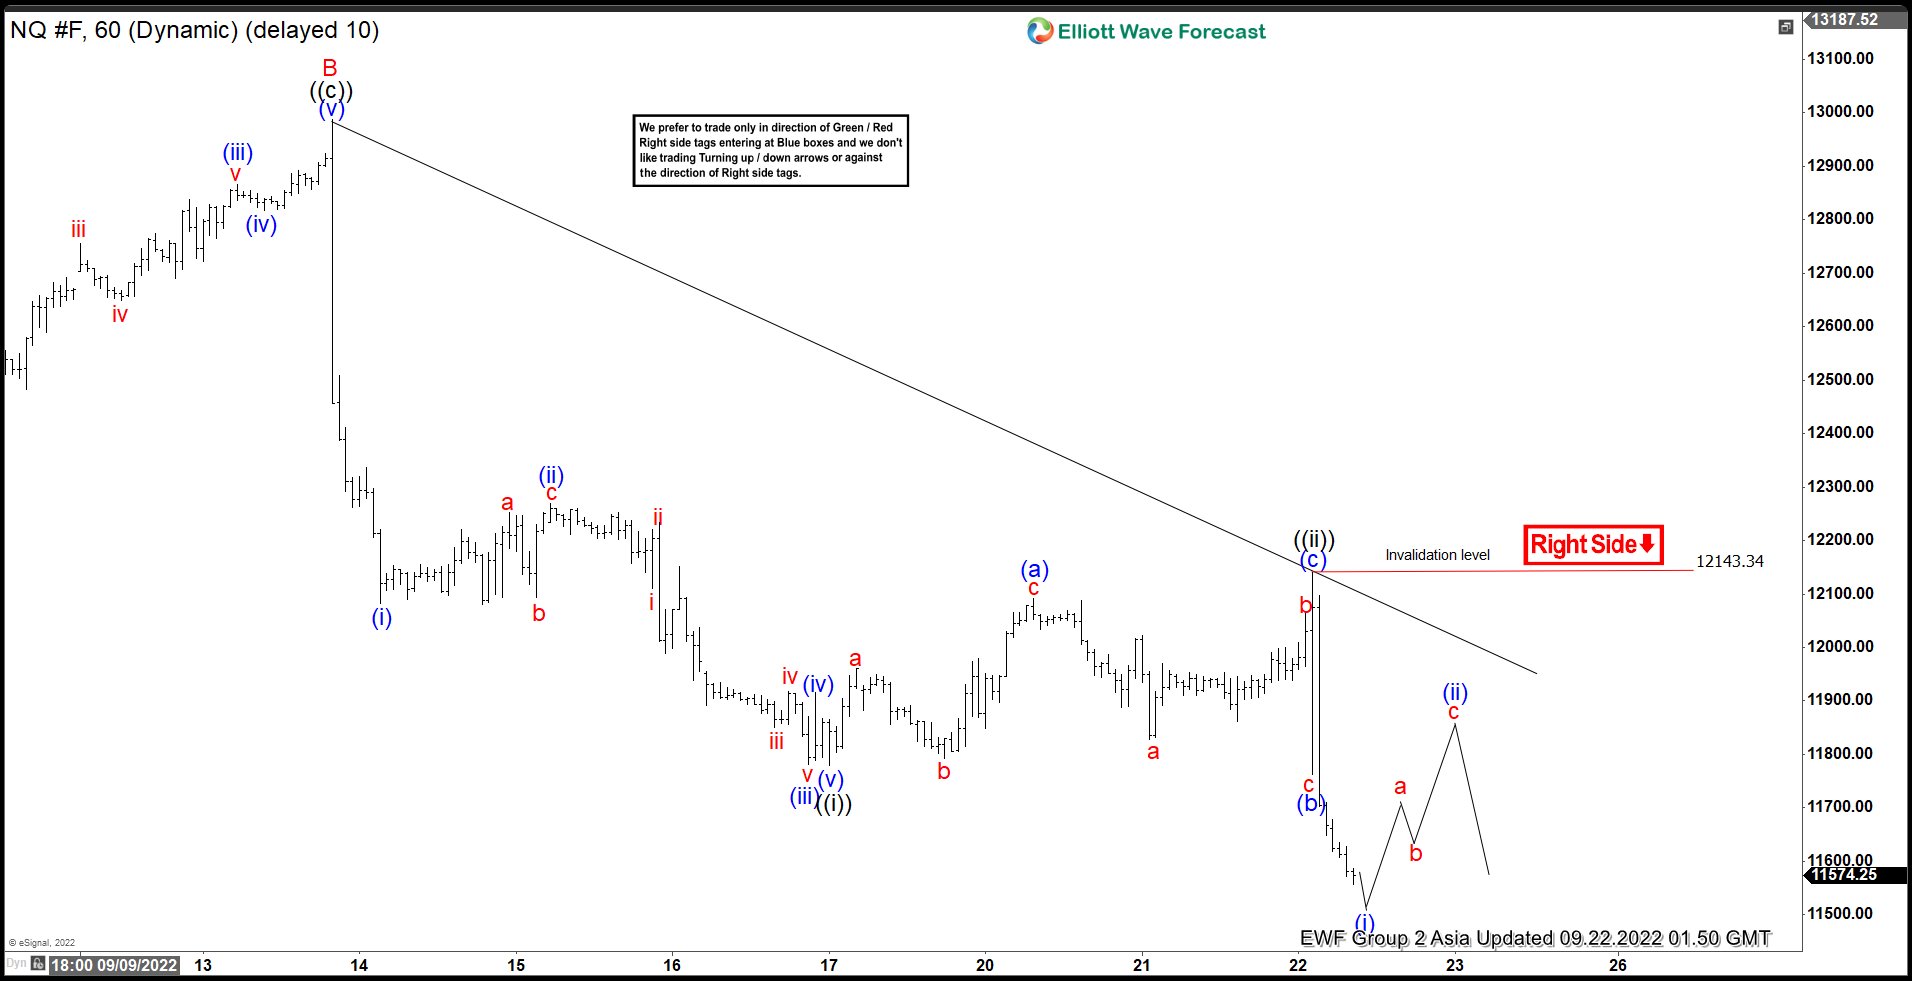
Short term Elliott Wave view on Nasdaq (NQ) suggests the decline from 8.17.2022 high is unfolding as a zigzag Elliott Wave structure. Down from 8.17 high, wave A ended at 12017.75. Wave B ended at 12986.74 with internal subdivision as an expanded flat. Up from wave A, wave ((a)) ended at 12461.50 and dips in wave ((b)) ended at 11921.50. Wave ((c)) higher ended at 12986.74 which also completed wave B.
Index has turned lower in wave C with internal subdivision as a 5 waves impulse. Down from wave B, wave ((i)) ended at 11778.50 and rally in wave ((ii)) ended at 12143.34. Internal subdivision of wave ((ii)) unfolded as an expanded flat. Up from wave ((i)), wave (a) ended at 12092.50, wave (b) ended at 11763.25, and wave (c) ended at 12143.34. This completed wave ((ii)) of C. Index has resumed lower in wave ((iii)). Near term, expect wave (i) of ((iii)) to end soon. Index should then rally in wave (ii) to correct cycle from 9.22.2022 high (12143.34) before it resumes lower. As far as pivot at 12143.34 stays intact, expect rally to fail in 3, 7, or 11 swing for further downside. Potential target lower is 100% – 161.8% Fibonacci extension of wave ((i)) which comes at 10195 – 10938.


