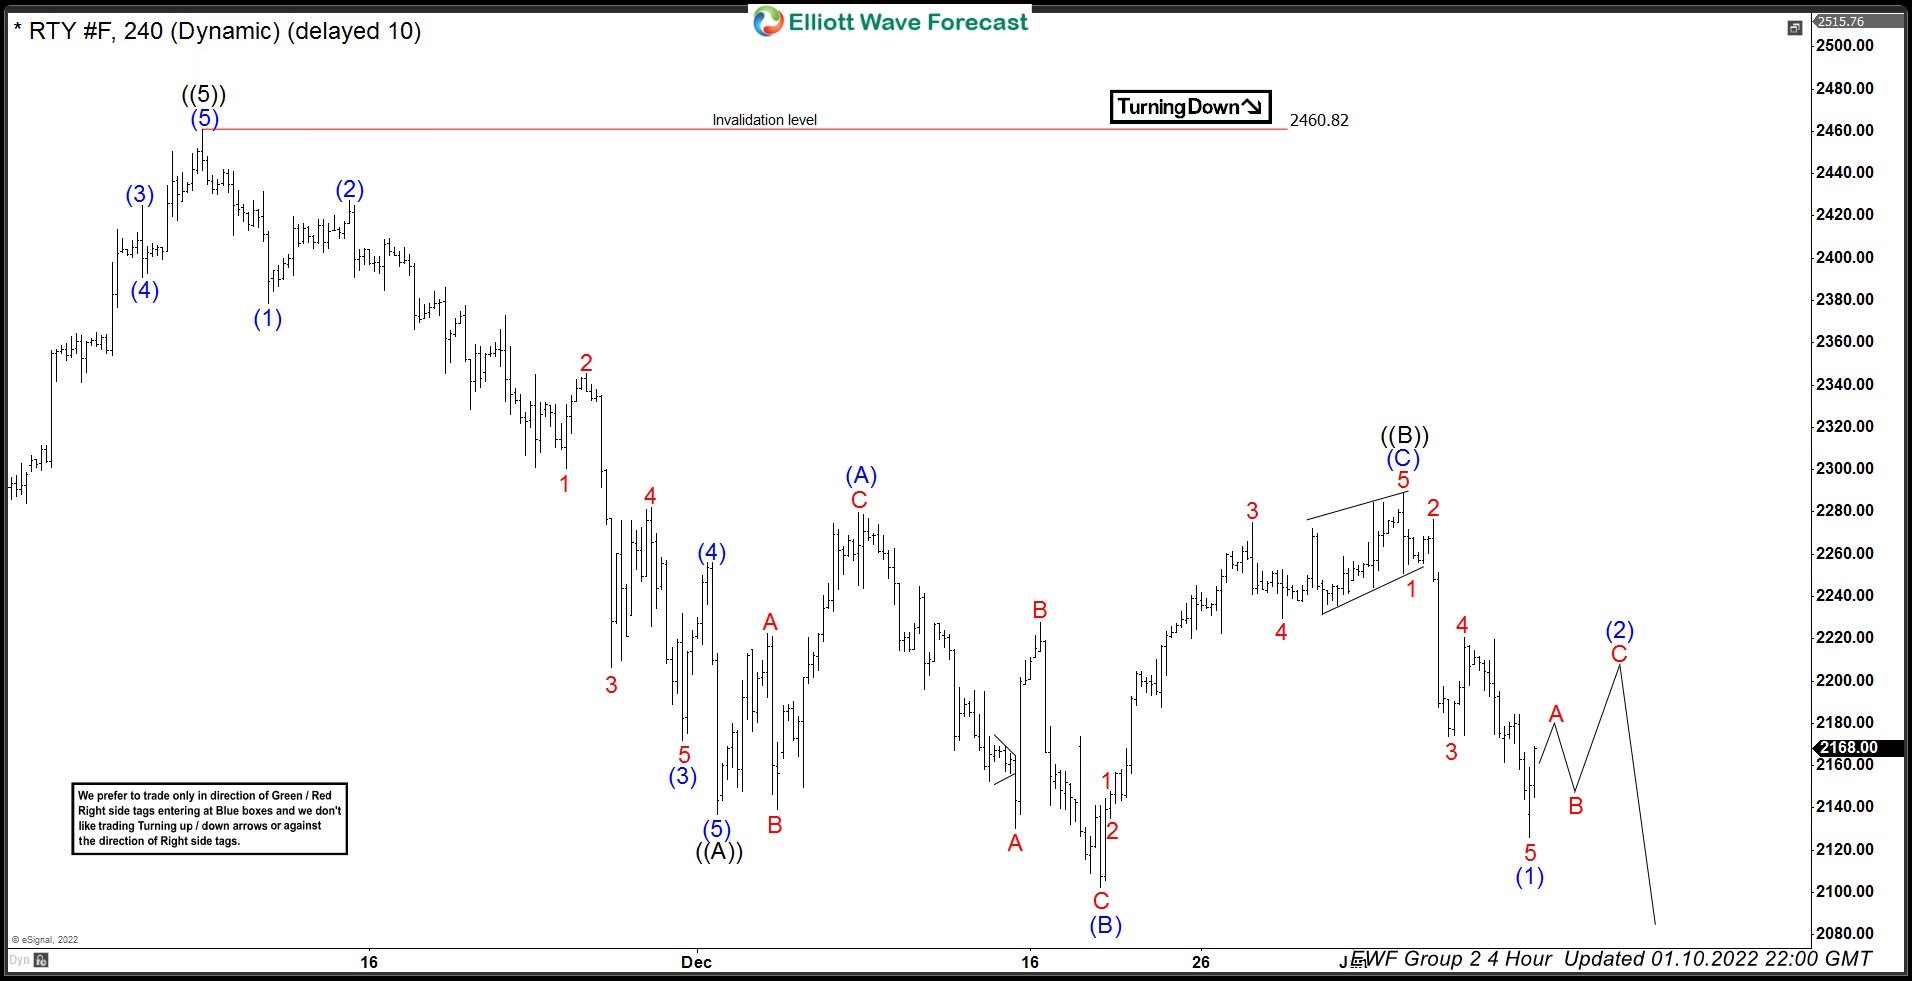
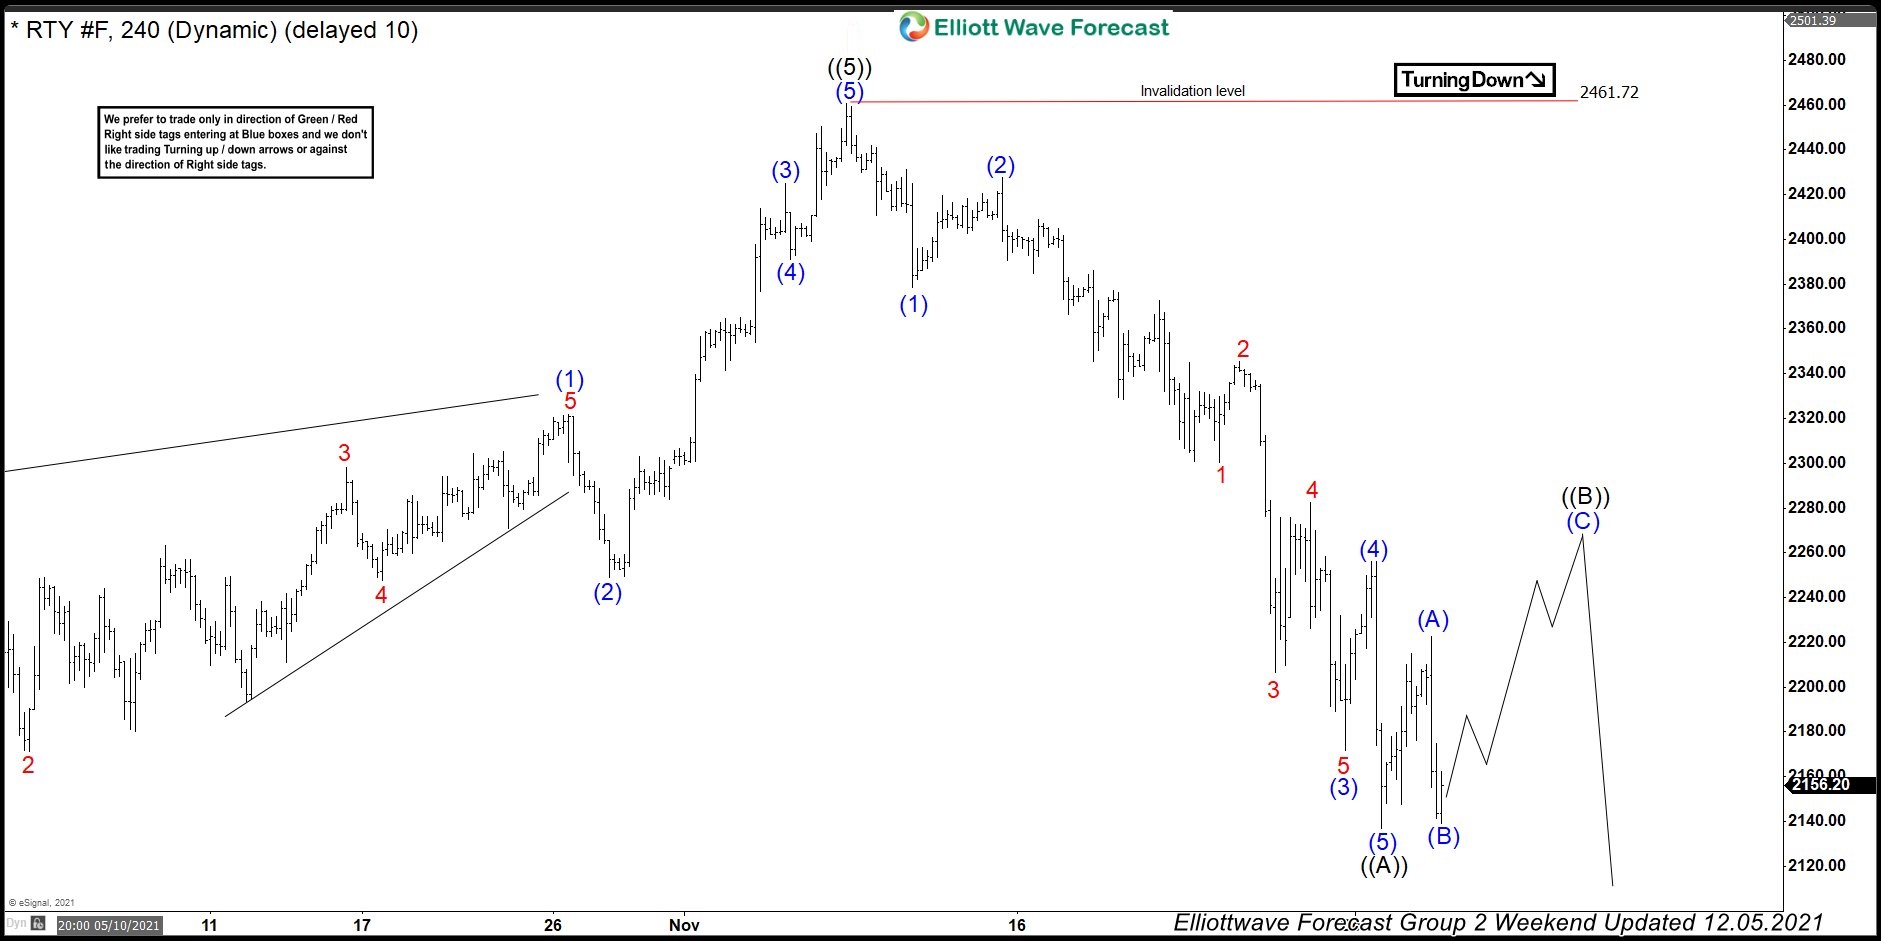
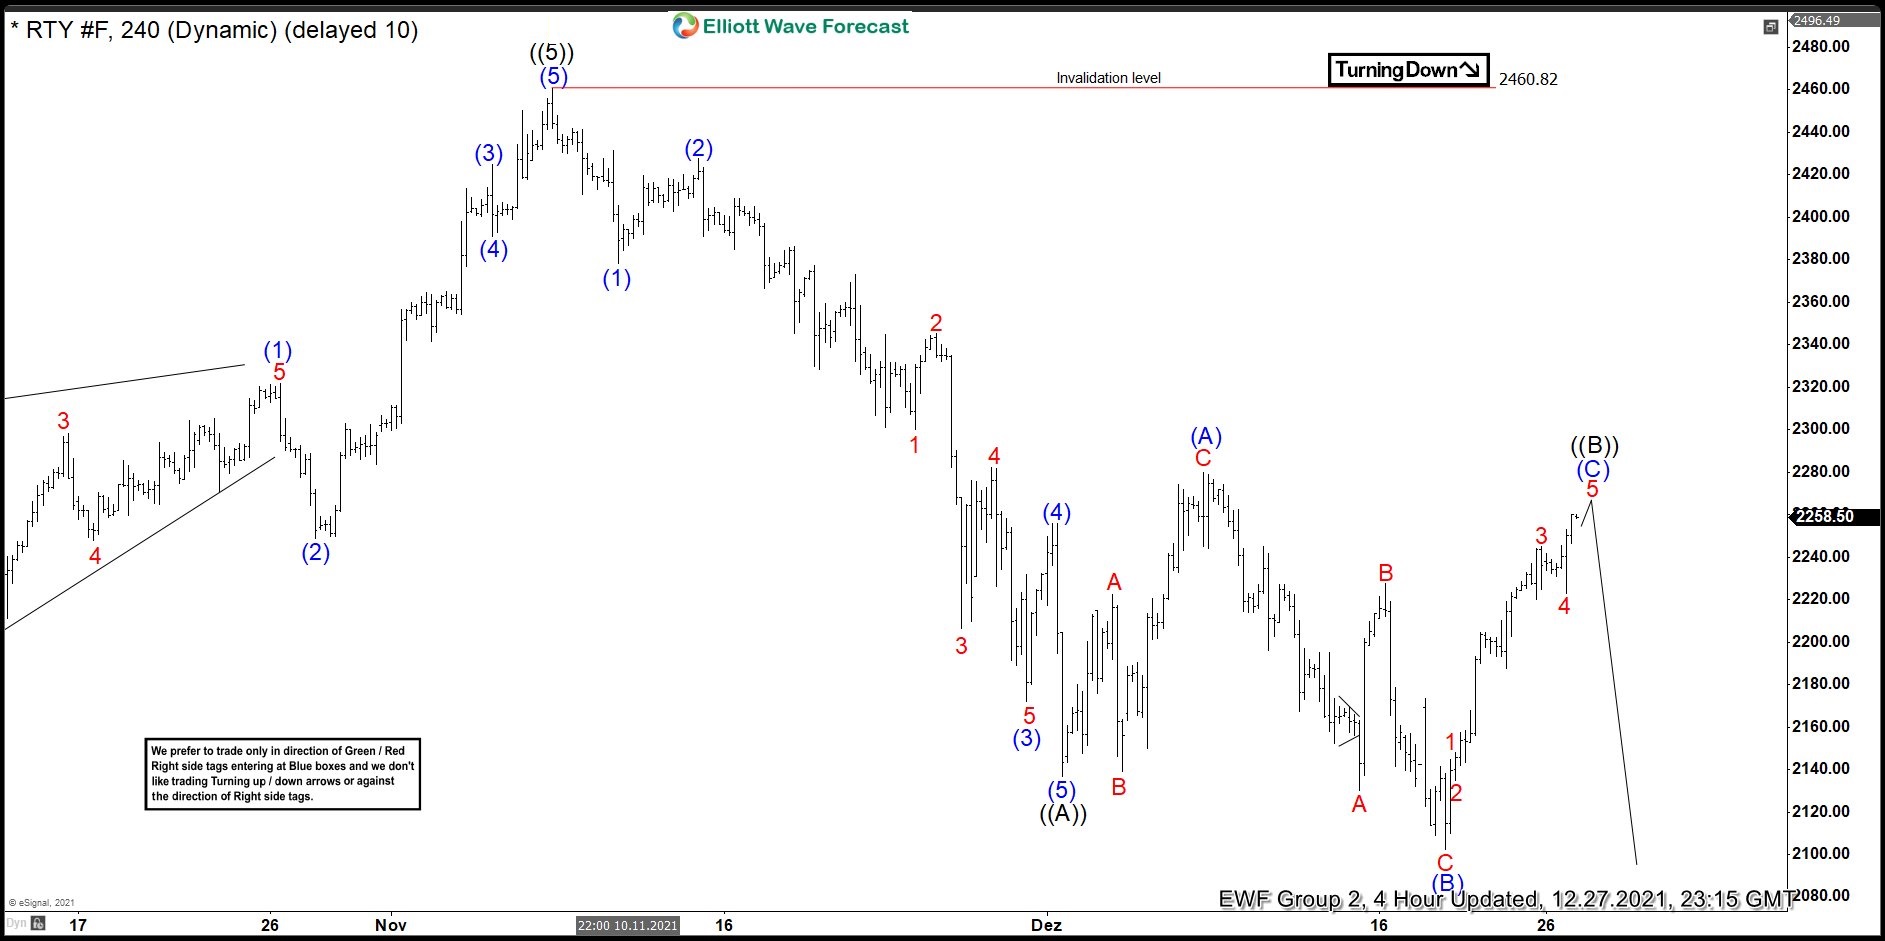
In this article, we look at how Russell Futures correction from 12.1.2021 low ended up taking the form of an Elliott Wave FLAT correction. We will look at various 4 hour charts presented to members of Elliottwave-Forecast between 12.5.2021 and 1.10.2022 and why we were convinced strong rally from 12.20.2021 was part of a FLAT correction and decline should resume again.
Russell Futures: Sellers Appear after Elliott Wave FLAT Structure
Stock Market
Subscribe to Get Free Market Insights
Professional Elliott Wave insights, charts, and forecasts to guide your trading decisions.
Related Articles
NewsStock Market
Tesla (TSLA) Elliott Wave Analysis: Price Action Shifts Higher in Impulsive Phase
Tesla (TSLA) has followed the broader pattern seen across major global indices and completed a...
Stock Market
$NFLX Elliott Wave Forecast: Incomplete Bullish Sequence Points to 115–130
In this Elliott Wave update, we take a look at the latest structure in Netflix...
NewsStock Market
Elliott Wave Signals Silver (XAGUSD) Recovery Path to $89
Silver (XAGUSD) rallied to $121.6 on January 29 before entering a sharp decline that reached...


