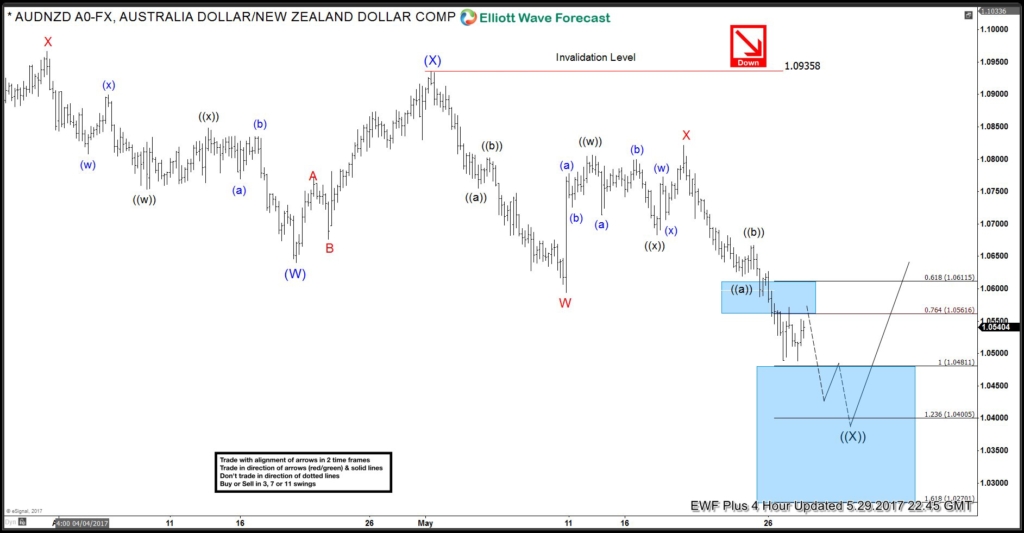
AUDNZD since March 13/2017 has been moving lower. There are possible bullish patterns that can push the pair higher but traders need to see AUDNZD price action slow down and show possible signs that it wants to reverse and bounce higher.
AUDNZD 4 hour Elliott Wave Analysis May 29/2017 : The pair can find support at the inflection zone (Blue box) where wave ((X)) can terminate and possibly bounce higher.
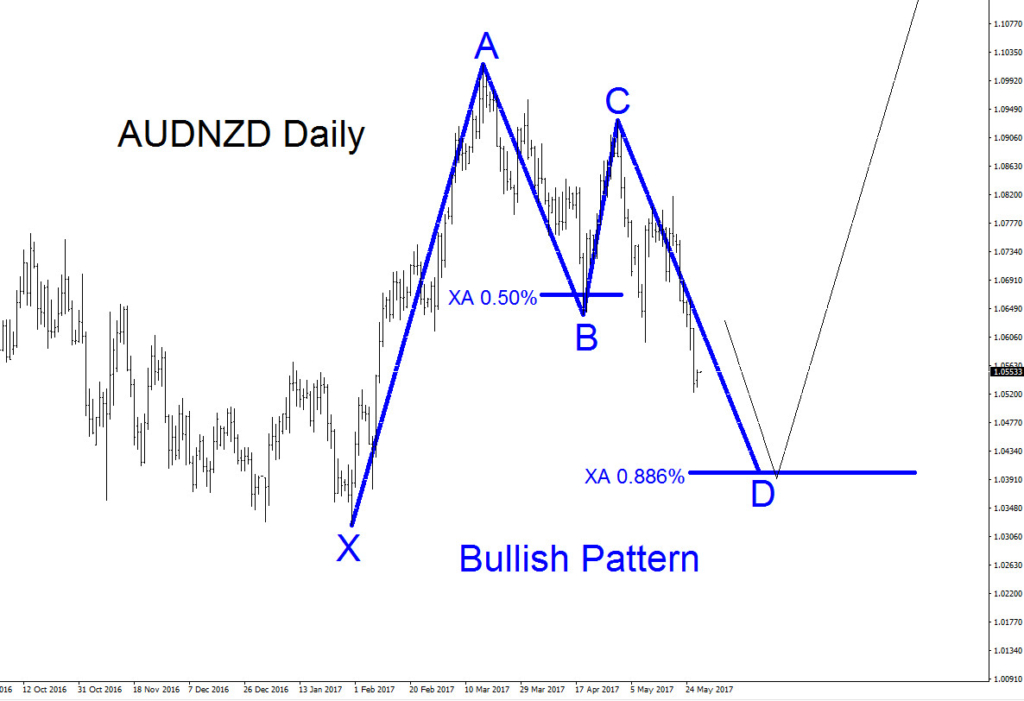
AUDNZD Daily Bullish Pattern #1 : Bullish pattern triggers BUYS at the XA 0.886% Fib. level coinciding with the above inflection zone (blue box). Only a break below point X of the blue pattern will invalidate the bullish pattern.
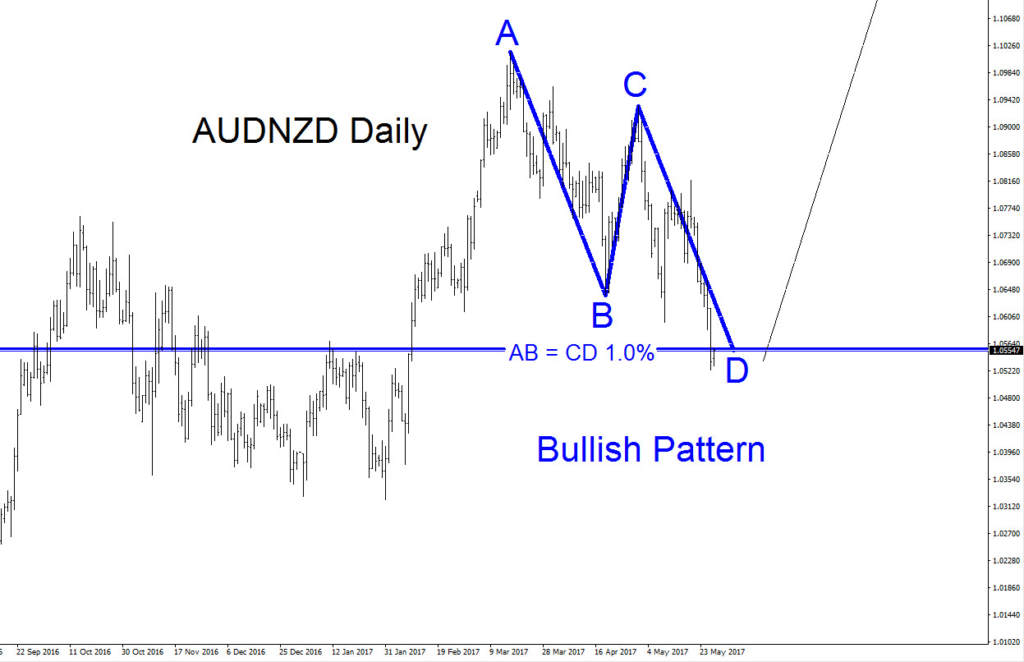
AUDNZD Daily Bullish Pattern #2 : There is also a possibility of AUDNZD not pushing lower and reversing higher from current levels. A bullish AB=CD pattern has already been triggered at the 1.0% Fib. extension level. As long as price stays above 1.0323 AUDNZD can bounce higher.
If looking to buy AUDNZD we prefer the blue bullish pattern #1 setup. Stops should be placed at 1.0323 (point blue X low) and should be bought at the XA 0.886% Fib. level (1.0402) minimum for a better risk/reward trade with targets above the point A high of the blue pattern #1.
Of course, like any strategy/technique, there will be times when the strategy/technique fails so proper money/risk management should always be used on every trade. Hope you enjoyed this article and follow me on Twitter for updates and questions> @AidanFX or chat me on Skype > EWF Aidan Chan
*** Always use proper risk/money management according to your account size ***
At Elliottwave-Forecast we cover 52 instruments (Forex, Commodities, Indices) in 4 different timeframes and we offer 3 Live Session Webinars everyday. We do Daily Technical Videos, Elliott Wave Trade Setup Videos and we have a 24 Chat Room. Our clients are always in the loop for the next market move.
Try Elliottwave-Forecast for 14 days FREE !!! Just click here –> 14 day FREE trial
Back


