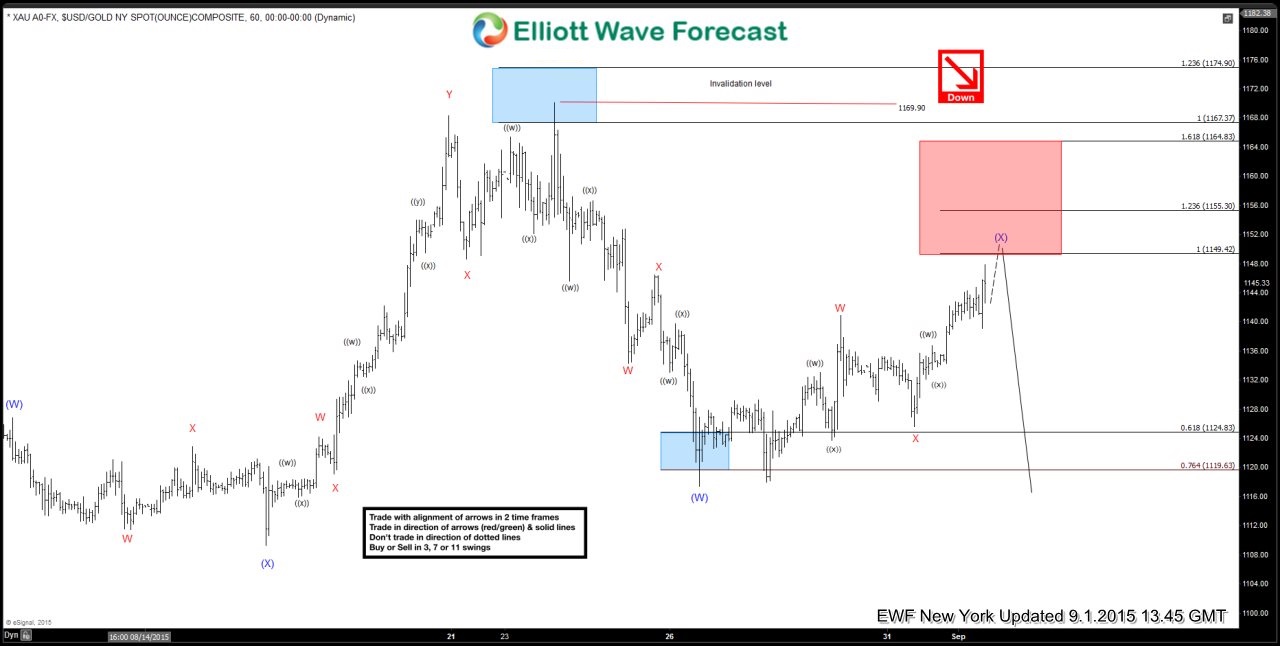
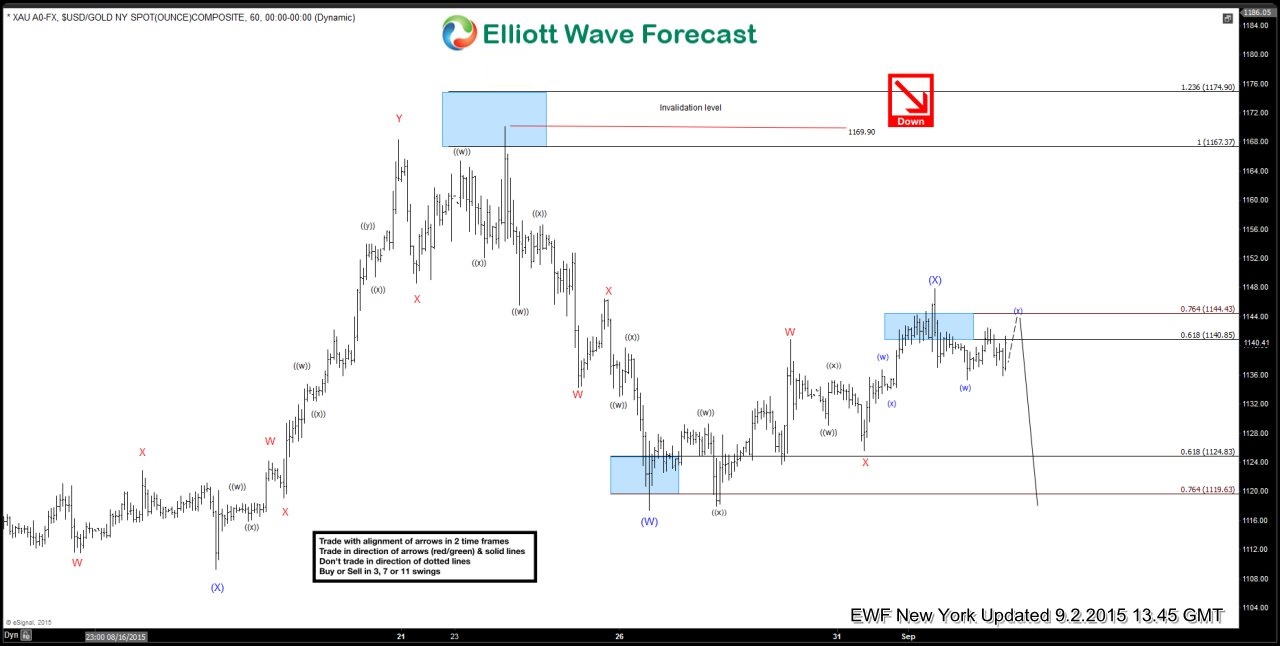
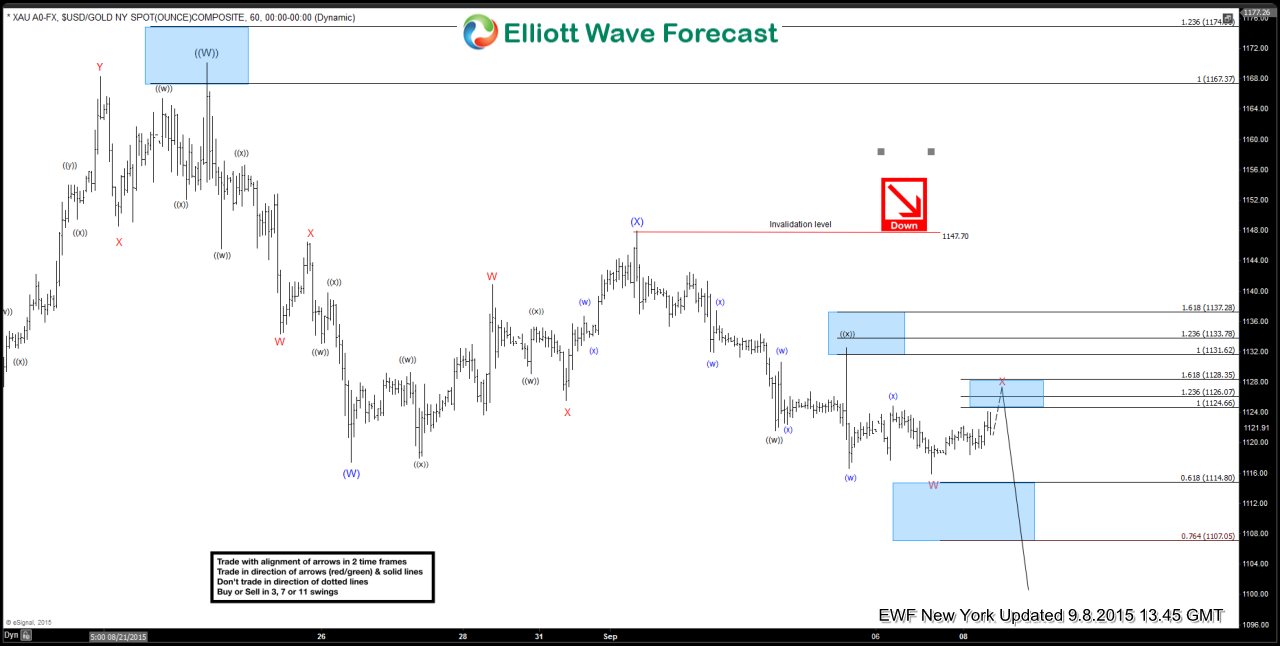
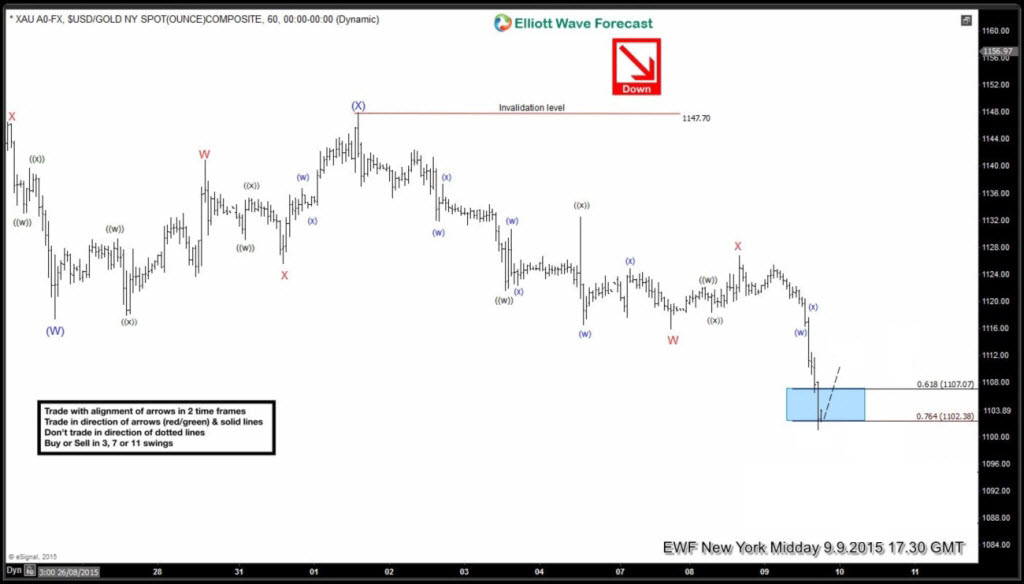
At the beginning of September our Elliott Wave analysis of GOLD (XAU/USD) suggested that we were still in bearish cycle from the 1169.9 high. The price was about to complete (X) recovery and were expecting more downside toward new lows below the 1117.47 level. First target came at 0.618-0.764 (W)-(X) at 1114.8-1107.05.
Let’s take a quick look at H1 Elliott Wave charts from the 01. September 2015 to see how we were guiding our members through the $GOLD (XAU/USD) price structure.
$GOLD (XAU/USD) H1 NY Update 9.1.2015 Elliott wave Chart suggests wave (X) recovery is about to complete. Another marginal push is possible toward equal legs area 1149.42 ( potential sell zone) before the decline takes place.
$GOLD (XAU/USD)H1 NY Update 9.2.2015 Although GOLD missed equal legs area at 1149.42 (by a few points) our system suggested the (X) recovery ended at 1147.7. While below mentioned high, next technical area comes at 0.618-0.764 (W)-(X) at 1114.8-1107.05.
$GOLD (XAU/USD) H1 NY Update 9.8.2015 The price made new low as expected but 0.618-0.764 fib extension area still hasn’t been reached. Current view suggests we’re in short term bounce- x which should ideally complete at 1124.6-1128.3 area. Once x recovery is done , more downside should follow.
$GOLD (XAU/USD) H1 NY Midday Update 9.9.2015 Wave x recovery ended at 1126.6 and we got more downside as expected.
Proper Elliott Wave counting is crucial in order to be a successful trader. If you want to learn more on how to implement Elliott Wave Theory in your trading, feel free to join us. You will get access to Professional Elliott Wave analysis in 4 different time frames,2 live webinars by our expert analysts every day, 24 hour chat room support, market overview, daily and weekly technical videos and much more…
If you are not member yet, just sign up here to get your Free 14 days Premium Plus Trial.
If you have any questions , feel free to contact me on twitter.
Welcome to Elliott Wave Forecast !
Back


