Royal Caribbean Cruises Ltd (NYSE: RCL), a top global cruise company, has overcome challenges and is poised for more growth. Since the 2020 crash, the stock has achieved remarkable growth, surging over +1000% and reaching new all-time highs. This impressive rally underscores its bullish momentum and resilience in overcoming past challenges. This article explores Elliott Wave analysis, revealing bullish patterns that could attract investors and traders alike.
RCL Weekly Chart
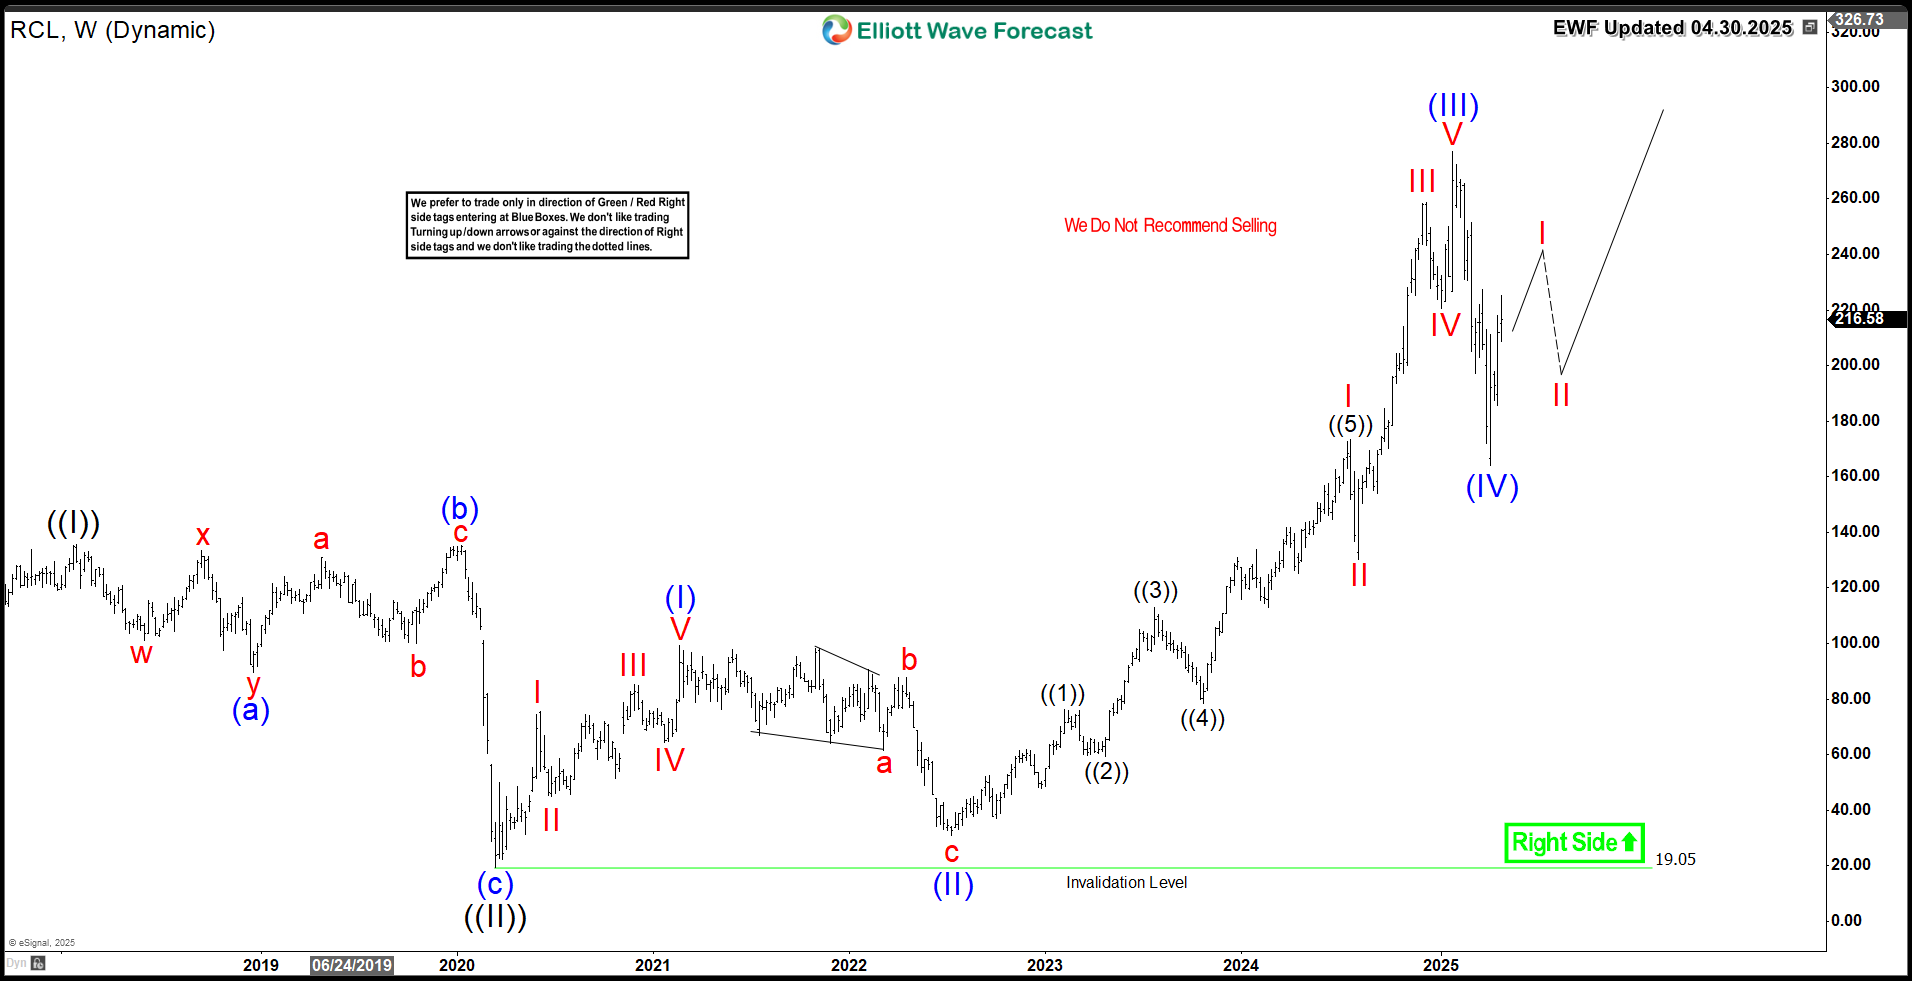
Elliott Wave Analysis
The above weekly chart of RCL shows an impulsive 3 waves move into new highs from wave ((II)) low $19. Wave (I) at $99, wave (II) at $31, wave (III) at $277 and recently it ended wave (IV) pullback at $164. Consequently, the current sequence is incomplete and it’s expected to rally higher in wave (V) of ((III)) before a larger correction takes place in wave ((IV)). The next upward leg targets the Fibonacci extension range of $304 – $348. This signals continued bullish momentum in RCL’s structure.
Conclusion
The bullish Grand Super Cycle for RCL is ongoing, suggesting opportunities to buy daily and weekly corrective pullbacks using our Elliott Wave strategy. The ideal approach involves purchasing after the stock completes a 3, 7, or 11 swing sequence from its peak. Leveraging our extreme Blue Box system helps pinpoint optimal entry points, ensuring clarity and accuracy in trading decisions. Explore our system to gain deeper insights into this methodology.
Discover the potential of Stocks & ETFs investing with our Exclusive 14-Day Trial.
✅Master the art of trading our Blue Boxes using the 3, 7, or 11 swings sequence
✅Access 78 instruments analyzed across 4 different time frames
✅Join Live Trading & Analysis Sessions hosted daily by our Expert Analysts
✅Enjoy 24-hour chat room support and much more
Take the opportunity to explore fresh ideas and sharpen your trading skills. Start your journey today!


