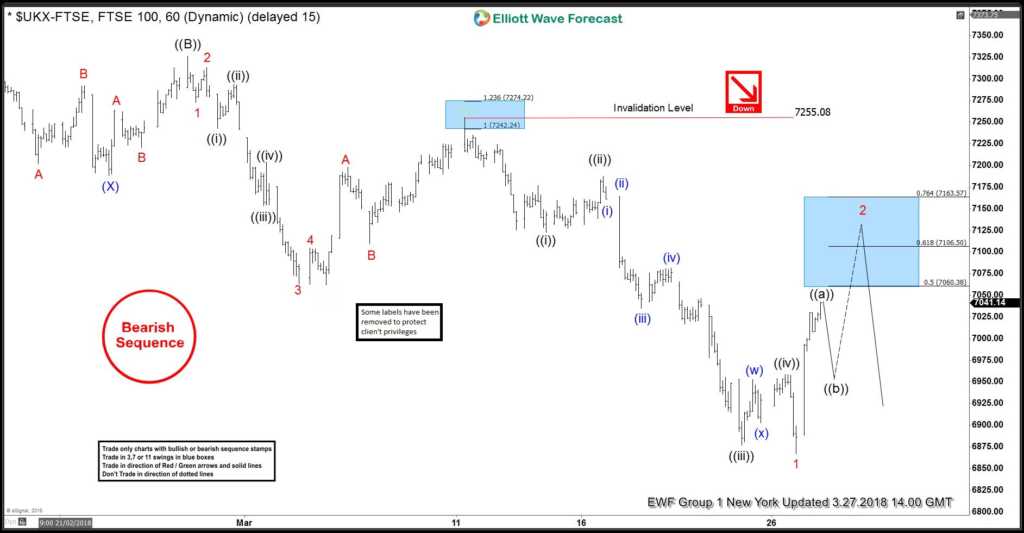
FTSE the index from UK, is correcting the larger degree cycle from February 2016 lows. While FTSE Elliott Wave Short-term price action suggests that the rally to February 27 high (7333.50) ended primary wave ((B)) bounce. Below from there, the decline is unfolding as a 5 waves Elliott Wave Impulse Sequence within primary ((C)) leg lower. Where each leg lower has an internal distribution of 5 waves structure thus favored being an impulse, which can be seen in the Chart below. Also, it’s important to note that the 1-hour Chart below is showing bearish sequence tag, which represents the incomplete sequence to the downside from January 2018 peak.
Now let’s take a look at the Short-term price action from March 13 peak (7255) to today’s low (6866.75). The decline from there can be seen in 5 waves impulse sequence, where internals of each leg is consist of 5 waves structure. Where Minute wave ((i)) ended at 7122.50, Minute wave ((ii)) ended at 7188.50 and Minute wave ((iii)) ended at 6876.75 low. Then from there, Minute wave ((iv)) ended at 6958.45 and Minute wave ((v)) of 1 ended at 6866.75 on today’s low. Above from there the index could be correcting the cycle from March 13 peak (7255) cycle in Minor wave 2 bounce or correlating with other world indices there’s a possibility that we could be correcting the cycle from February 27 peak primary wave ((B)) peak still. Either way, as explained above the sequence from January 2018 peak remain bearish to the downside and index should ideally see seller’s in 3, 7 or 11 swings for further weakness against 7255 high in the first degree or against 7333.50 high in the second degree.
Within the Shorter cycles, the index so far is showing a Minor wave 2 bounce in single swing structure which is labeled as Zigzag structure. Then while staying above 6866.75 today’s low the index is expected to see another push higher approximately towards 7106.50-716357 .618-0.764% Fibonacci extension area of a cycle from March 13 peak before it resumes the decline. We don’t like buying the index and prefer selling the Minor wave 2 bounce in 3, 7 or 11 swings.
FTSE Elliott Wave 1 Hour Chart
Elliott Wave Forecast
Keep in mind that the market is dynamic and the FTSE Elliott Wave view could change in the meantime. Success in trading requires proper risk and money management as well as an understanding of Elliott Wave theory, cycle analysis, and correlation. We have developed a very good trading strategy that defines the entry.
Stop loss and take profit levels with high accuracy and allows you to take a risk-free position, shortly after taking it by protecting your wallet. If you want to learn all about it and become a professional trader then trade our Blue Boxes with a special deal. Click here => To get 30% discount on all monthly plans in our spring break sale.
Back


