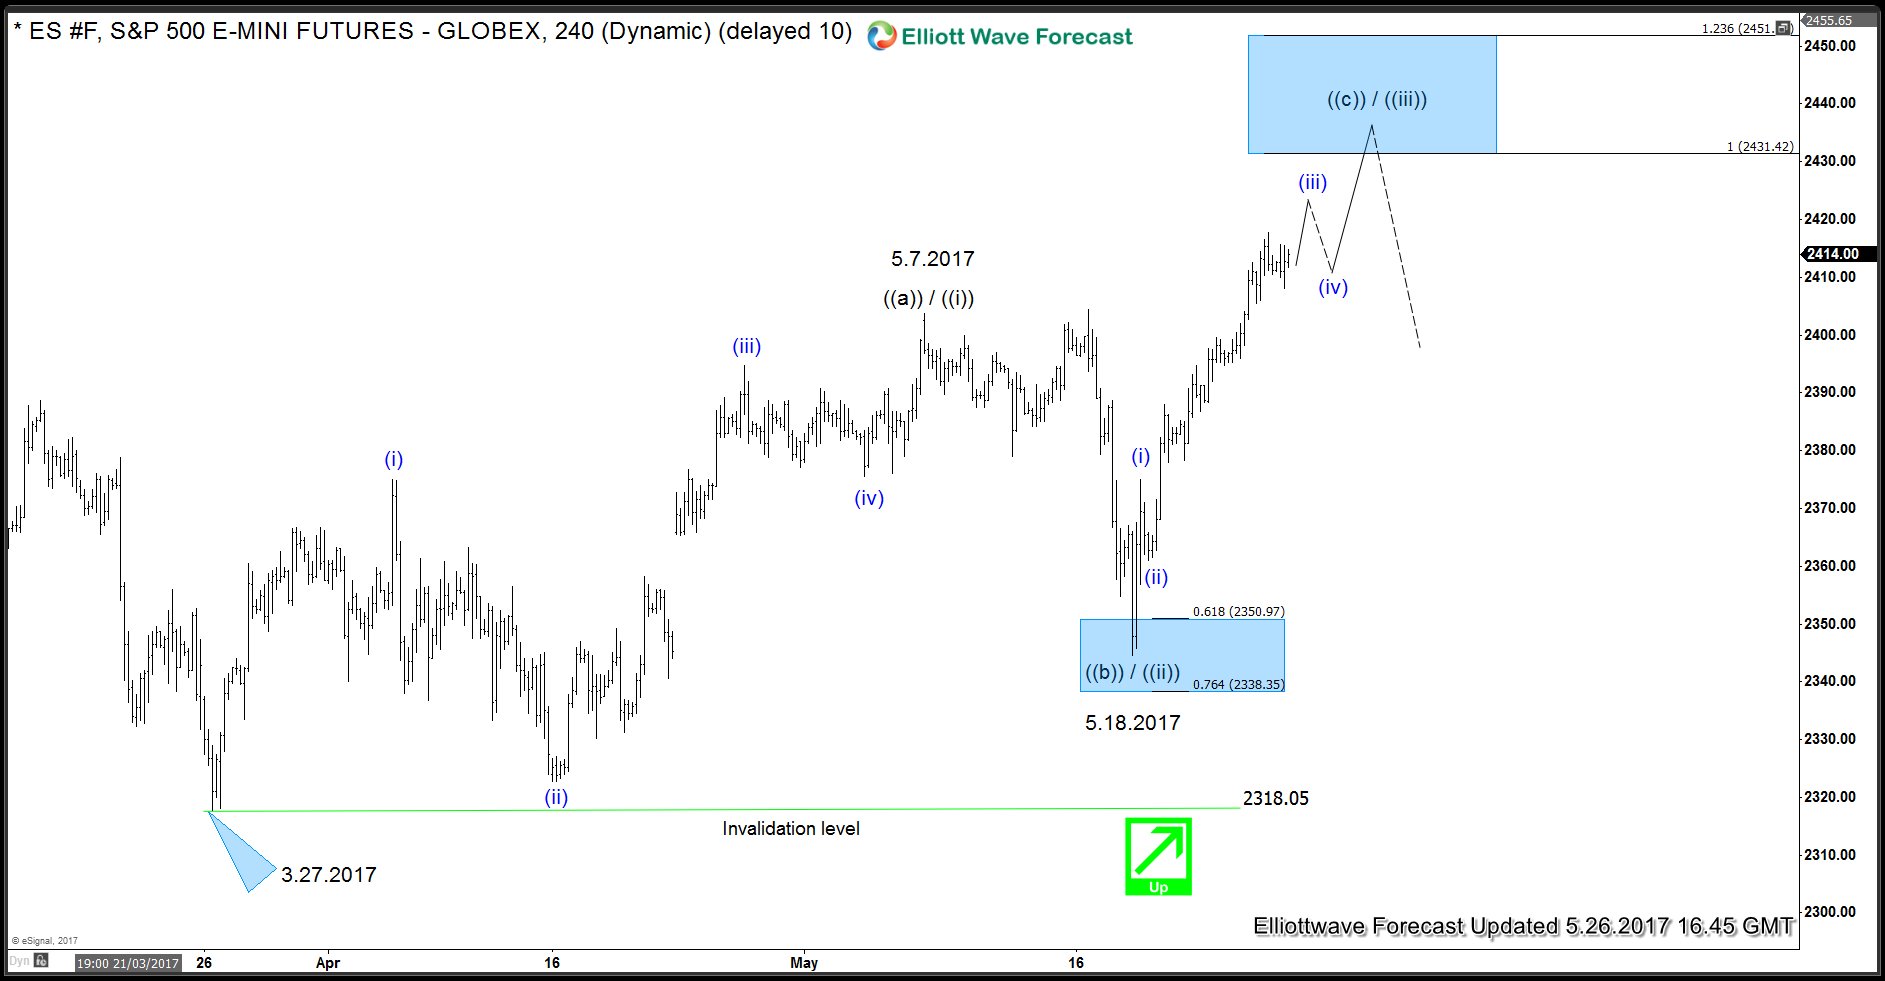
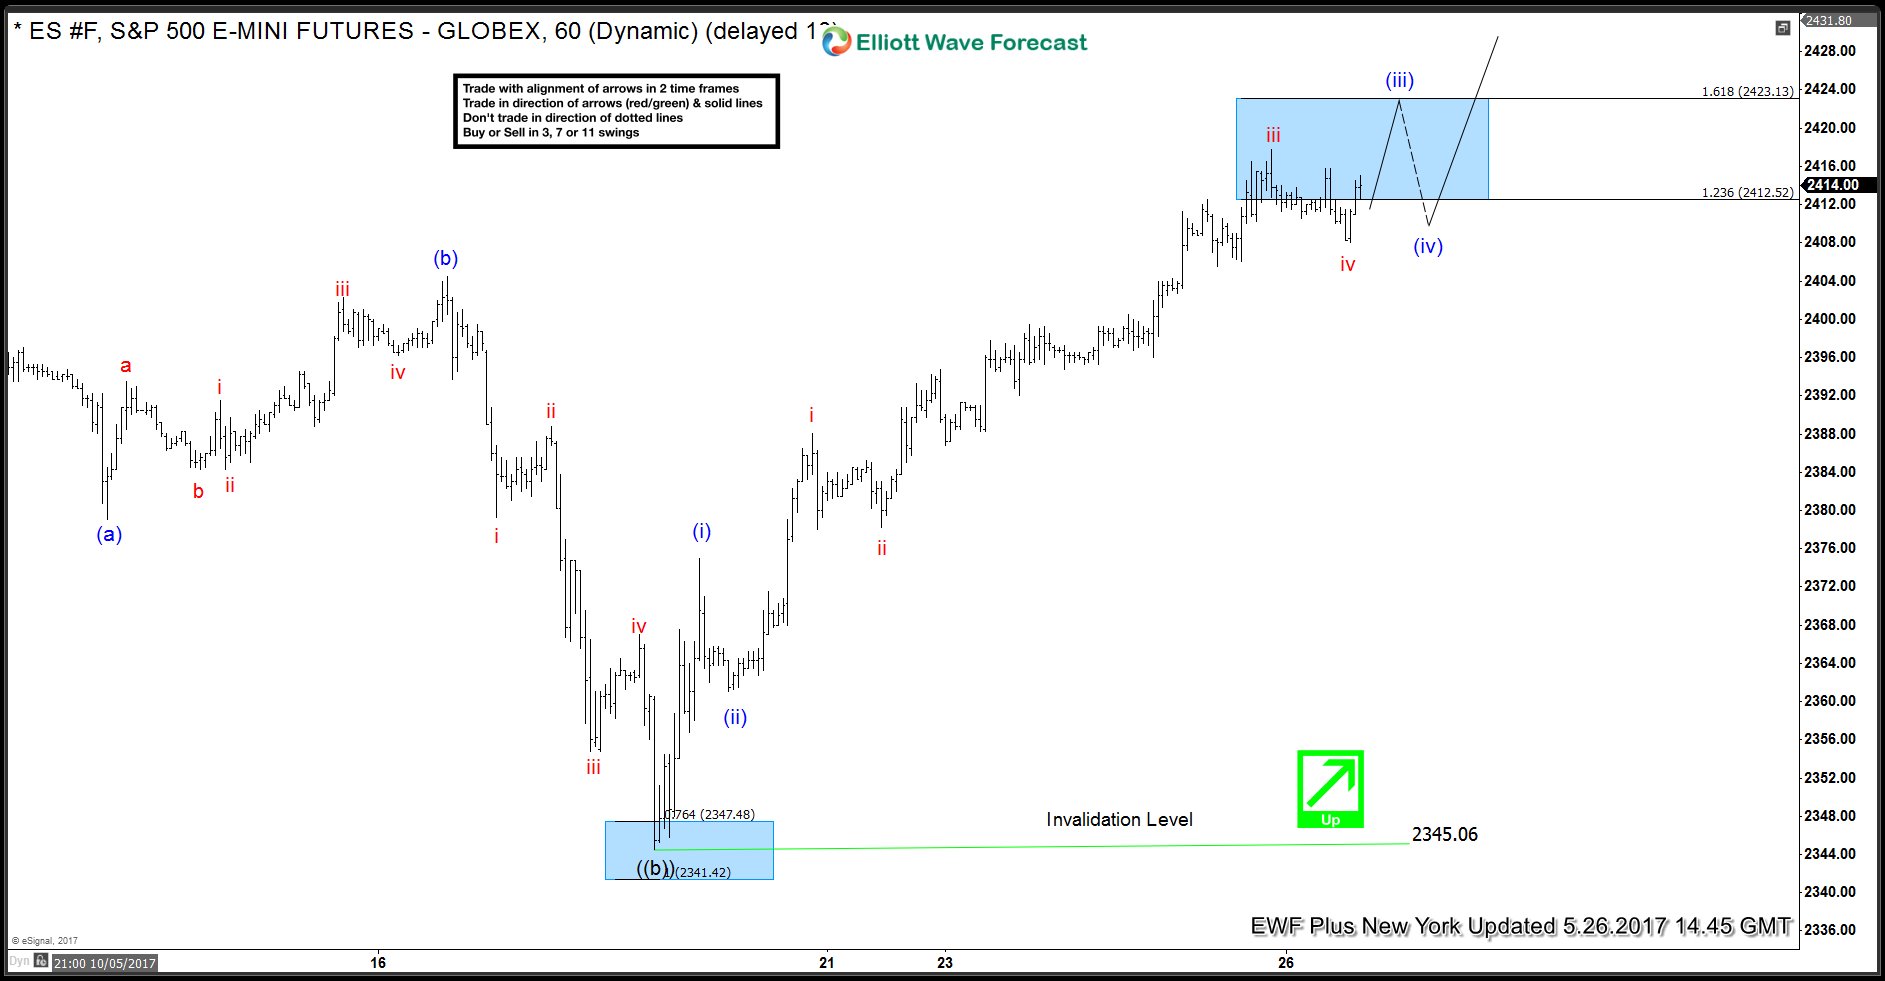
Short Term Elliott Wave view in $ES_F E-Mini S&P suggests that the rally from 5.18.2017 (2344.5) low is unfolding as a 5 waves Elliott Wave impulse structure where Minutte wave (i) ended at 2375, Minutte wave (ii) ended at 2361, and Minutte wave (iii) remains in progress and can reach 2423.13 or 161.8% fibonacci extension of Minutte wave (i). Expect Minutte wave (iv) pullback to start once Minutte wave (iii) is over before turning higher one more leg in Minutte wave (v) towards blue box area at 2431-2451.
$ES_F 4 Hour chart looking for 2431 – 2451 area
$ES_F 1 Hour Elliott Wave Analysis 5.26.2017
Highlighted area between 2431 – 2451 should complete an Elliott wave Zigzag structure from 3.27.2017 (2318.05) low or it could complete Minute wave ((iii)) of a incomplete diagonal pattern. In either case, from the blue box area, $ES_F would either correct the cycle from 3.27.2017 flow or just correct the cycle from 5.18.2017 2344.5 low in a wave ((iv)) and extend higher in wave ((v)) to complete a diagonal structure higher from 3.27.2017 low. Either way, we don’t like selling the Index in proposed pullbacks and expect buyers to appear again once $ES_F ends the current cycle between 2431 – 2451 area and then pull back in 3, 7 or 11 swings provided that the pivot at 2344.7 low remains intact in first degree and 2318 low in the second degree.
Keep in mind that the market is dynamic and the view could change in the mean time. Success in trading requires adequate risk and money management, as is the understanding of Elliott Wave theory, cycle analysis and correlation. We have developed a very sensitive trading strategy that defines entry, stop loss and take profit levels with high accuracy and allows you to take risk free position shortly after taking it by protecting your wallet. If you want to learn all about it and become a professional trader, register now and get Free 14 day trial.
Back


