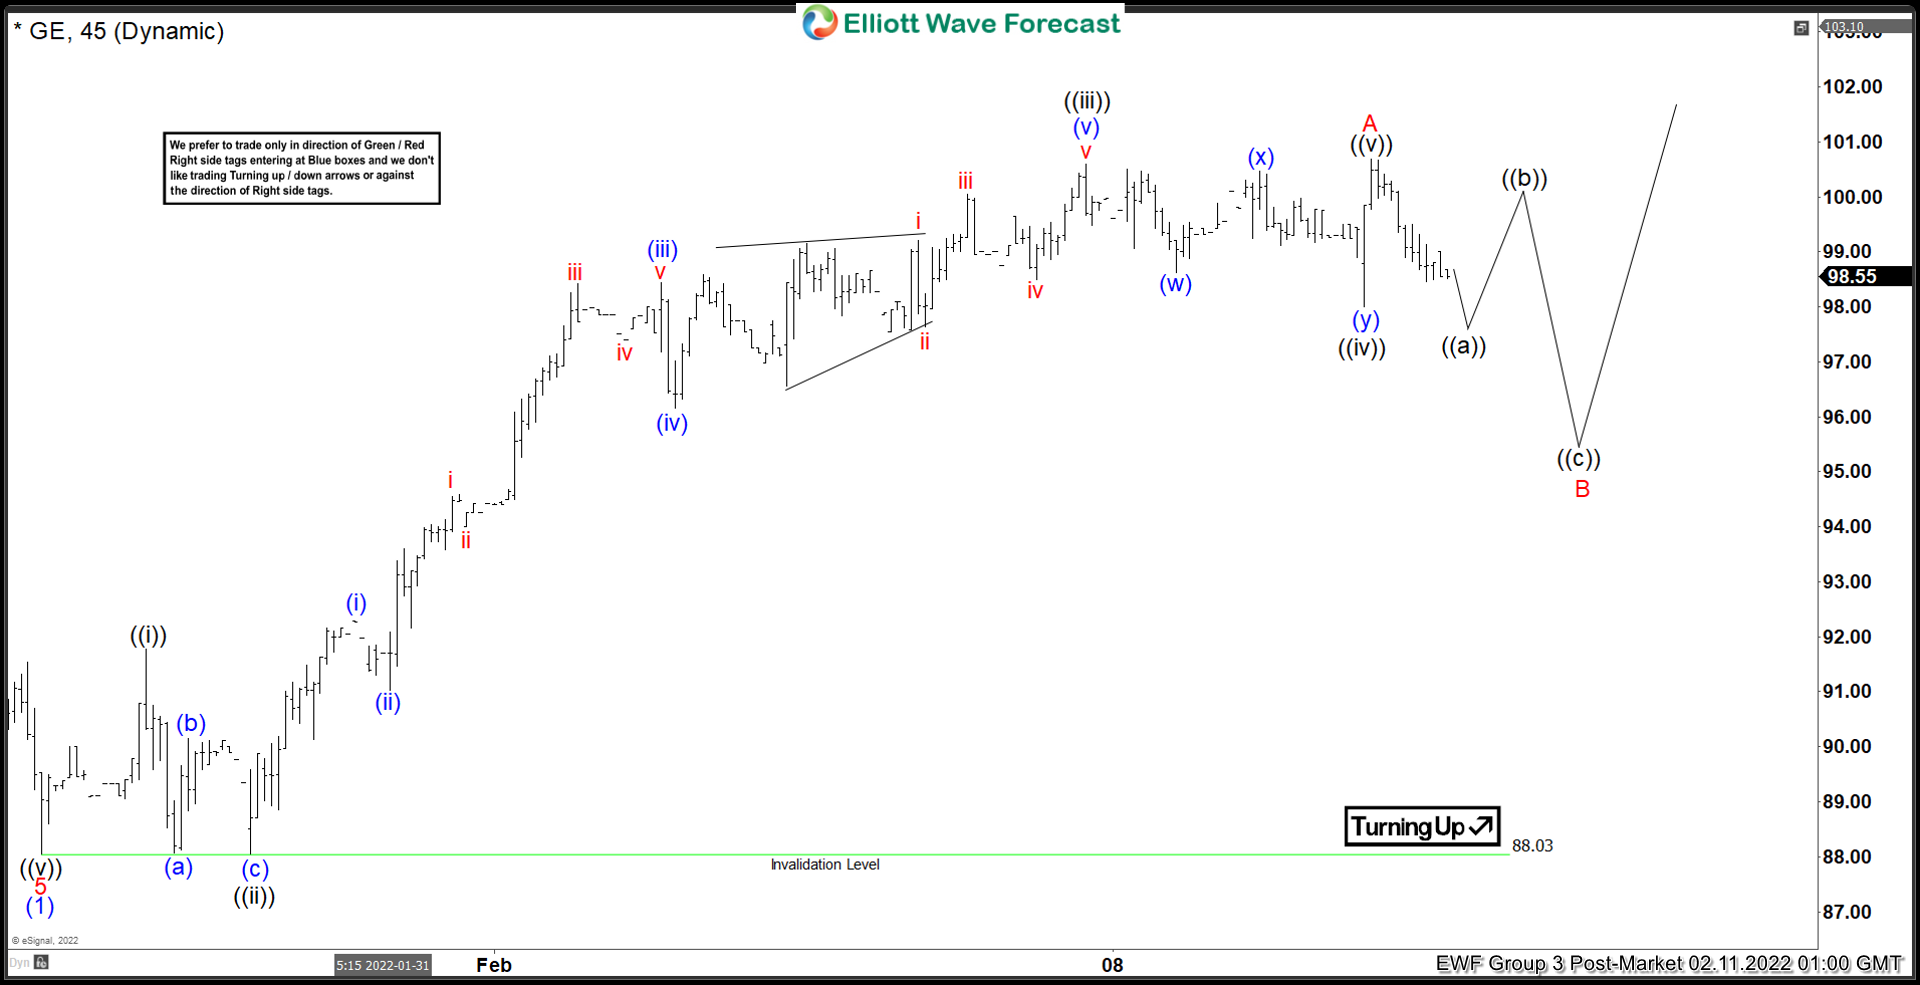
The short-term Elliott wave view in General Electric (GE) ended wave (1) at 88.03 low. Wave (2) rally is currently in progress as a zigzag Elliott Wave structure. Up from wave (1), wave A of the zigzag ended at 100.68 with internal subdivision as 5 waves impulse. Up from wave (1), wave ((i)) ended at 91.77 and pullback in wave ((ii)) ended at 88.05. The stock then extended higher again in wave ((iii)) towards 100.59. Wave ((iii)) subdivided again as a 5 waves of lesser degree. Up from wave ((ii)), wave (i) ended at 92.28, wave (ii) dips ended at 91.03, wave (iii) ended at 98.44, wave (iv) ended at 96.16, and wave (v) ended at 100.59.
Wave ((iv)) pullback ended at 98. Internal of wave ((iv)) subdivided as a double three. Down from wave ((iii)), wave (w) ended at 98.63, wave (x) ended at 100.47, and wave (y) ended at 98. This completed wave ((iv)). Stock then extended higher in wave ((v)) towards 100.68 which should also complete wave A. The stock is now pulling back in wave B to correct cycle from January 27 low. Internal of wave B is unfolding as a zigzag structure where wave ((a)) should end soon. The stock should bounce in wave ((b)) before it resumes lower again in wave ((c)). As far as pivot at 88.03 low stays intact, expect pullback to find support in 3, 7, or 11 swing for more upside.


