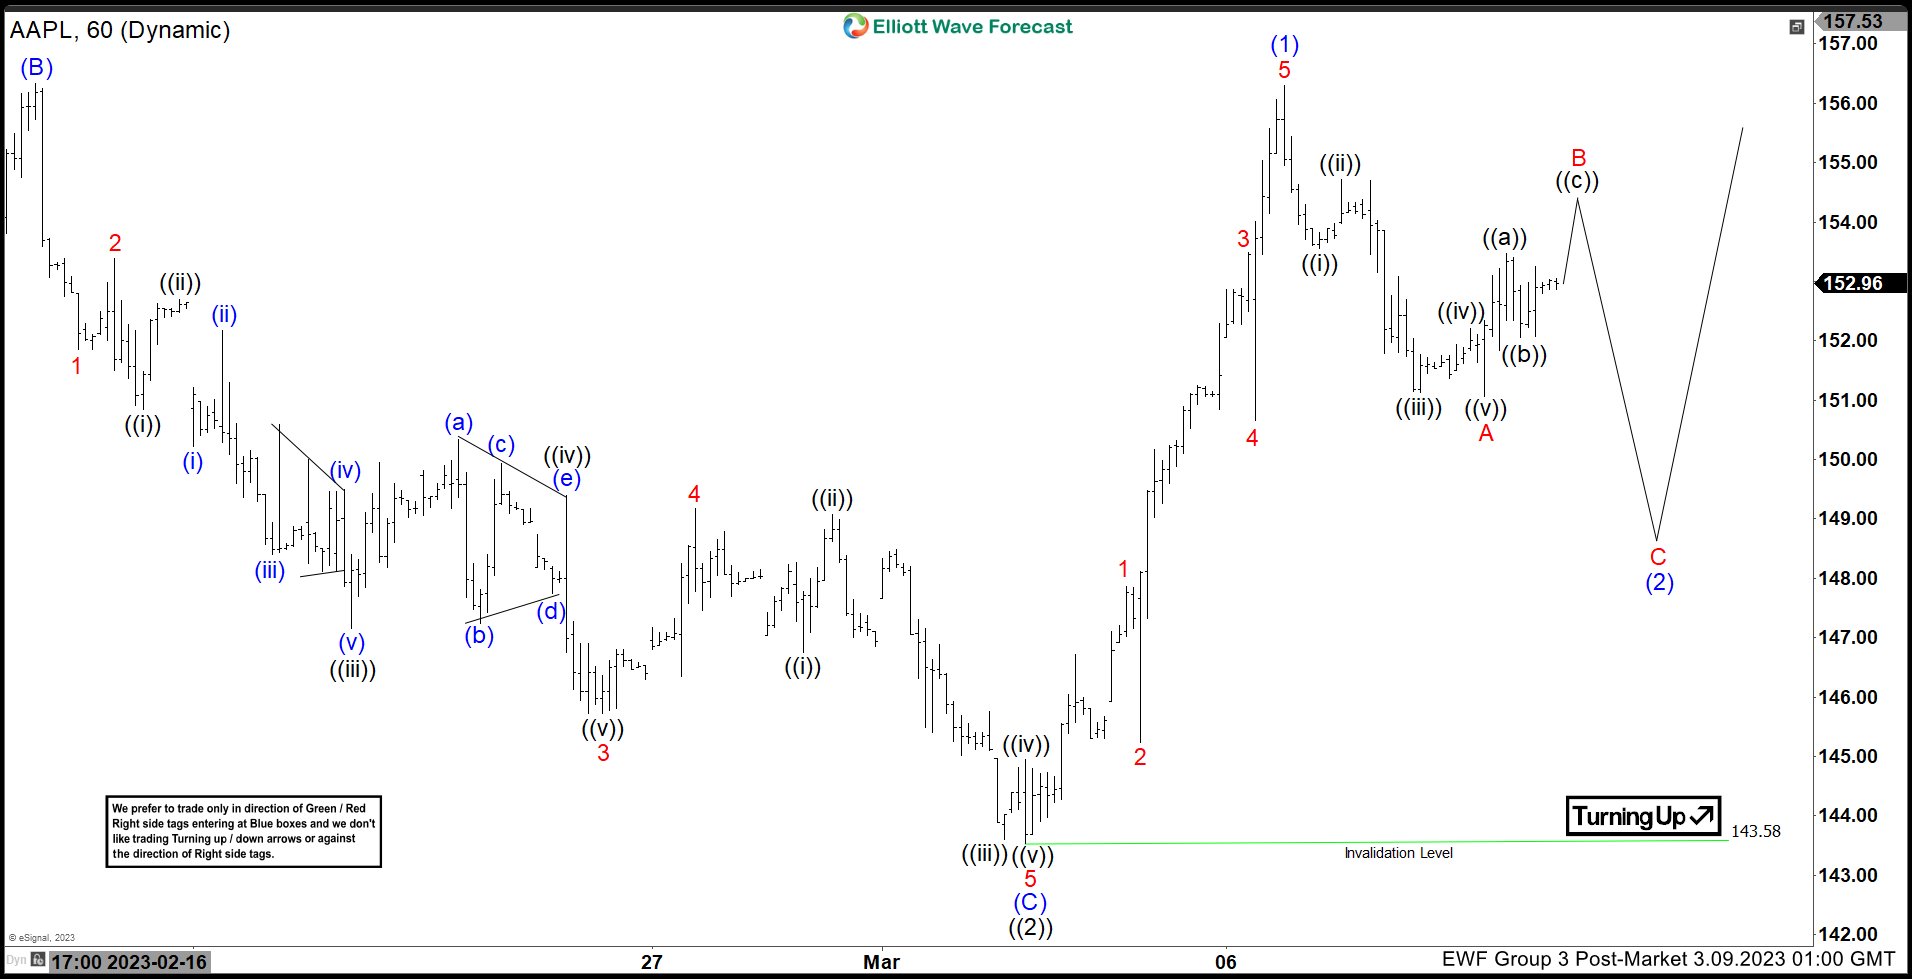
Cycle from 1.4.2023 low is in progress as a 5 waves impulse Elliott Wave structure. Up from 1.4.2023 low, wave ((1)) ended at 157.38 and pullback in wave ((2)) ended at 143.54 as the 1 hour chart below shows. Internal subdivision of wave ((2)) unfolded as a zigzag structure. Down from wave ((1)), wave (A) ended at 148.7 and rally in wave (B) ended at 156.33. Wave (C) lower subdivided into 5 waves impulse. Down from wave (B), wave 1 ended at 151.85 and wave 2 ended at 153.39. Stock resumes lower in wave 3 towards 145.72 and wave 4 ended at 149.17. Final leg wave 5 ended at 143.58 which completed wave (C) of ((2)) in higher degree.
Stock turns higher in wave ((3)) with internal subdivision as a 5 waves impulse. Up from wave ((2)), wave 1 ended at 147.87 and dips in wave 2 ended at 145.23. Stock resumes higher again in wave 3 towards 153.49 and dips in wave 4 ended at 150.65. Final leg wave 5 ended at 156.30 which completed wave (1). Stock is now correcting cycle from 3.2.2023 low within wave (2) with internal subdivision as a zigzag. Down from wave (1), wave A ended at 151.08. Expect the stock to rally in wave B then turns lower again in wave C before ending wave (2) and resumes higher. As far as pivot at 143.58 low stays intact, expect dips to find support in 3, 7, or 11 swing for further upside.


