How we traded the BOJ this January
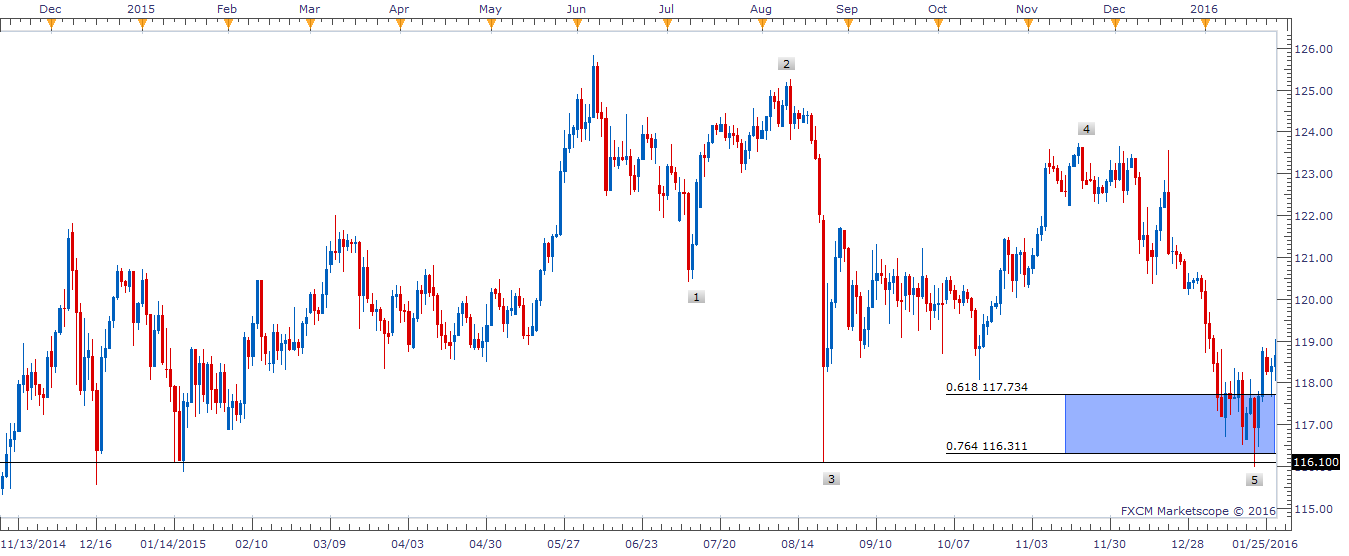
USDJPY did took the 08.24.2015 lows (116.07) fractionally on the move down from November last year’s secondary peak on 1.20.2016 later, as the lows formed that day was (115.96), which was also the 5th swing target area 0.618-0.764% extension (117.68-116.23) and completed the 5 swing structure from June last year’s peak.
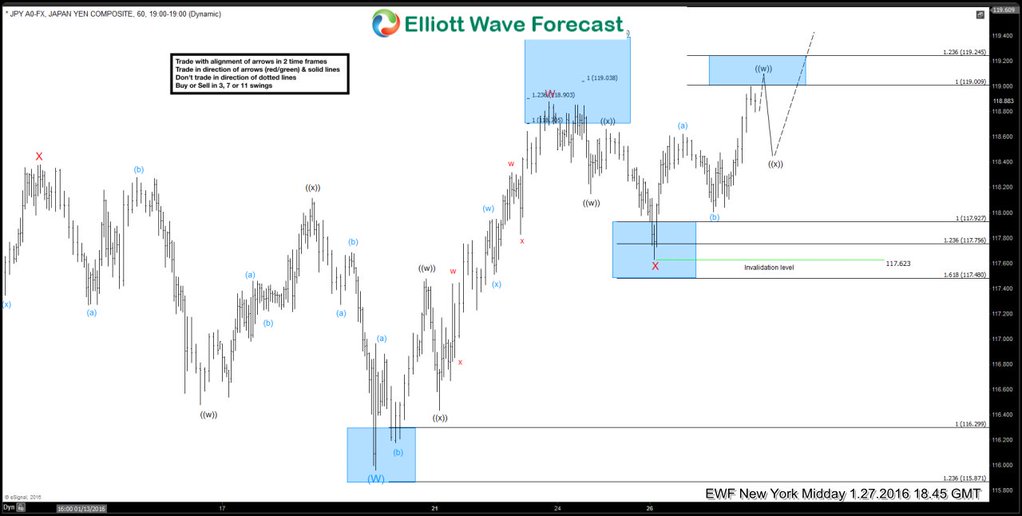
We at EWF were knew that downside is not done yet and uses the upcoming bounces as a selling opportunity in 3, 7 and 11 swings against the November last year’s peak for another extension lower similar to the move down from November to January low, as the move down from the peak was corrective in nature and correlation & distribution was suggesting more downside after a strong bounce. As we expressed on the blog on 01.25.2016 https://elliottwave-forecast.com/technical-blog/378557/ besides whatever actions maintained by Bank of japan on 1.29.2016 Yen pairs were calling for more upside. Below is the 1 hour chart of 01.27.2016 reflecting the low (115.95) of 01.20.2016 labelled as wave ( W ) in blue, where first leg higher bounce was a double three corrective structure in first leg higher labelled as wave W in red, which ended at 01.22.2016 peak (118.87). While wave X connector pullback against the 01.20 lows also unfolded as double three structure at (117.62) on 01.26 low with projection of another leg higher similar to wave W in red as the price holds above 01.26 (117.62).
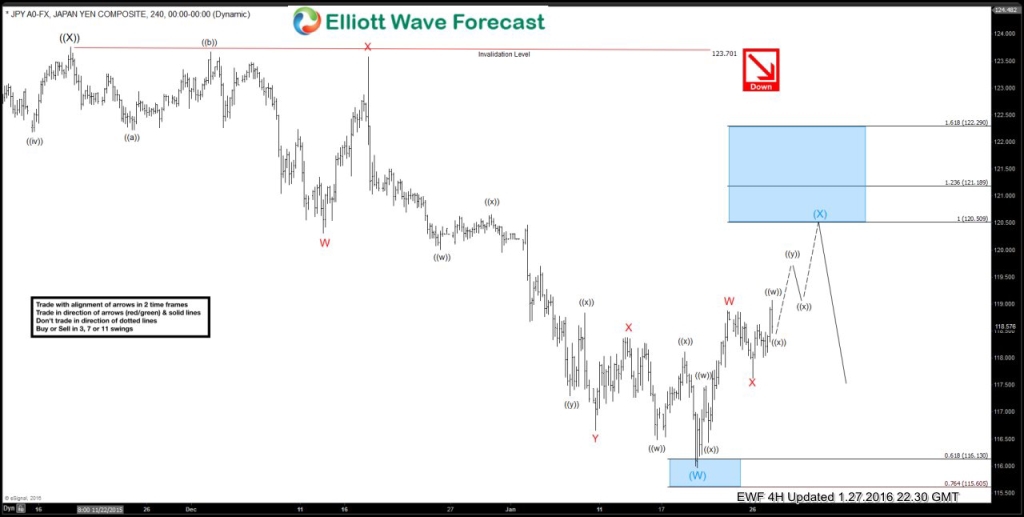
As the 4 hour chart below dated 01.27.2016 is pointing the inflection area in blue box (120.50-122.29) area in wave ( X ) in blue, as a selling opportunity against the November last year’s peak (123.71) for extension lower in wave ( Y ). And thus offered a nice selling opportunity for our clients.
If you want to know further how we look at $USDJPY, Yen crosses or other forex pairs and Indices using Elliottwave technique, sign in today for a limited 14 days FREE trial to see our Hourly, 4 Hour, Daily and Weekly Elliott wave chart and find inflection areas to trade.
Back


