In this technical blog, we are going to take a look at the past performance of BABA 1-Hour Elliott wave Charts that we presented to our members. In which, the decline from 3.18.2026 high took place in an impulse sequence and showed a lower sequence calling for more downside to happen. Therefore, our members knew that selling the bounce in the direction of the right side tag remained the preferred path. We will explain the Elliott wave structure & selling opportunity our members took below:
BABA 1-Hour Elliott Wave Chart From 3.25.2026
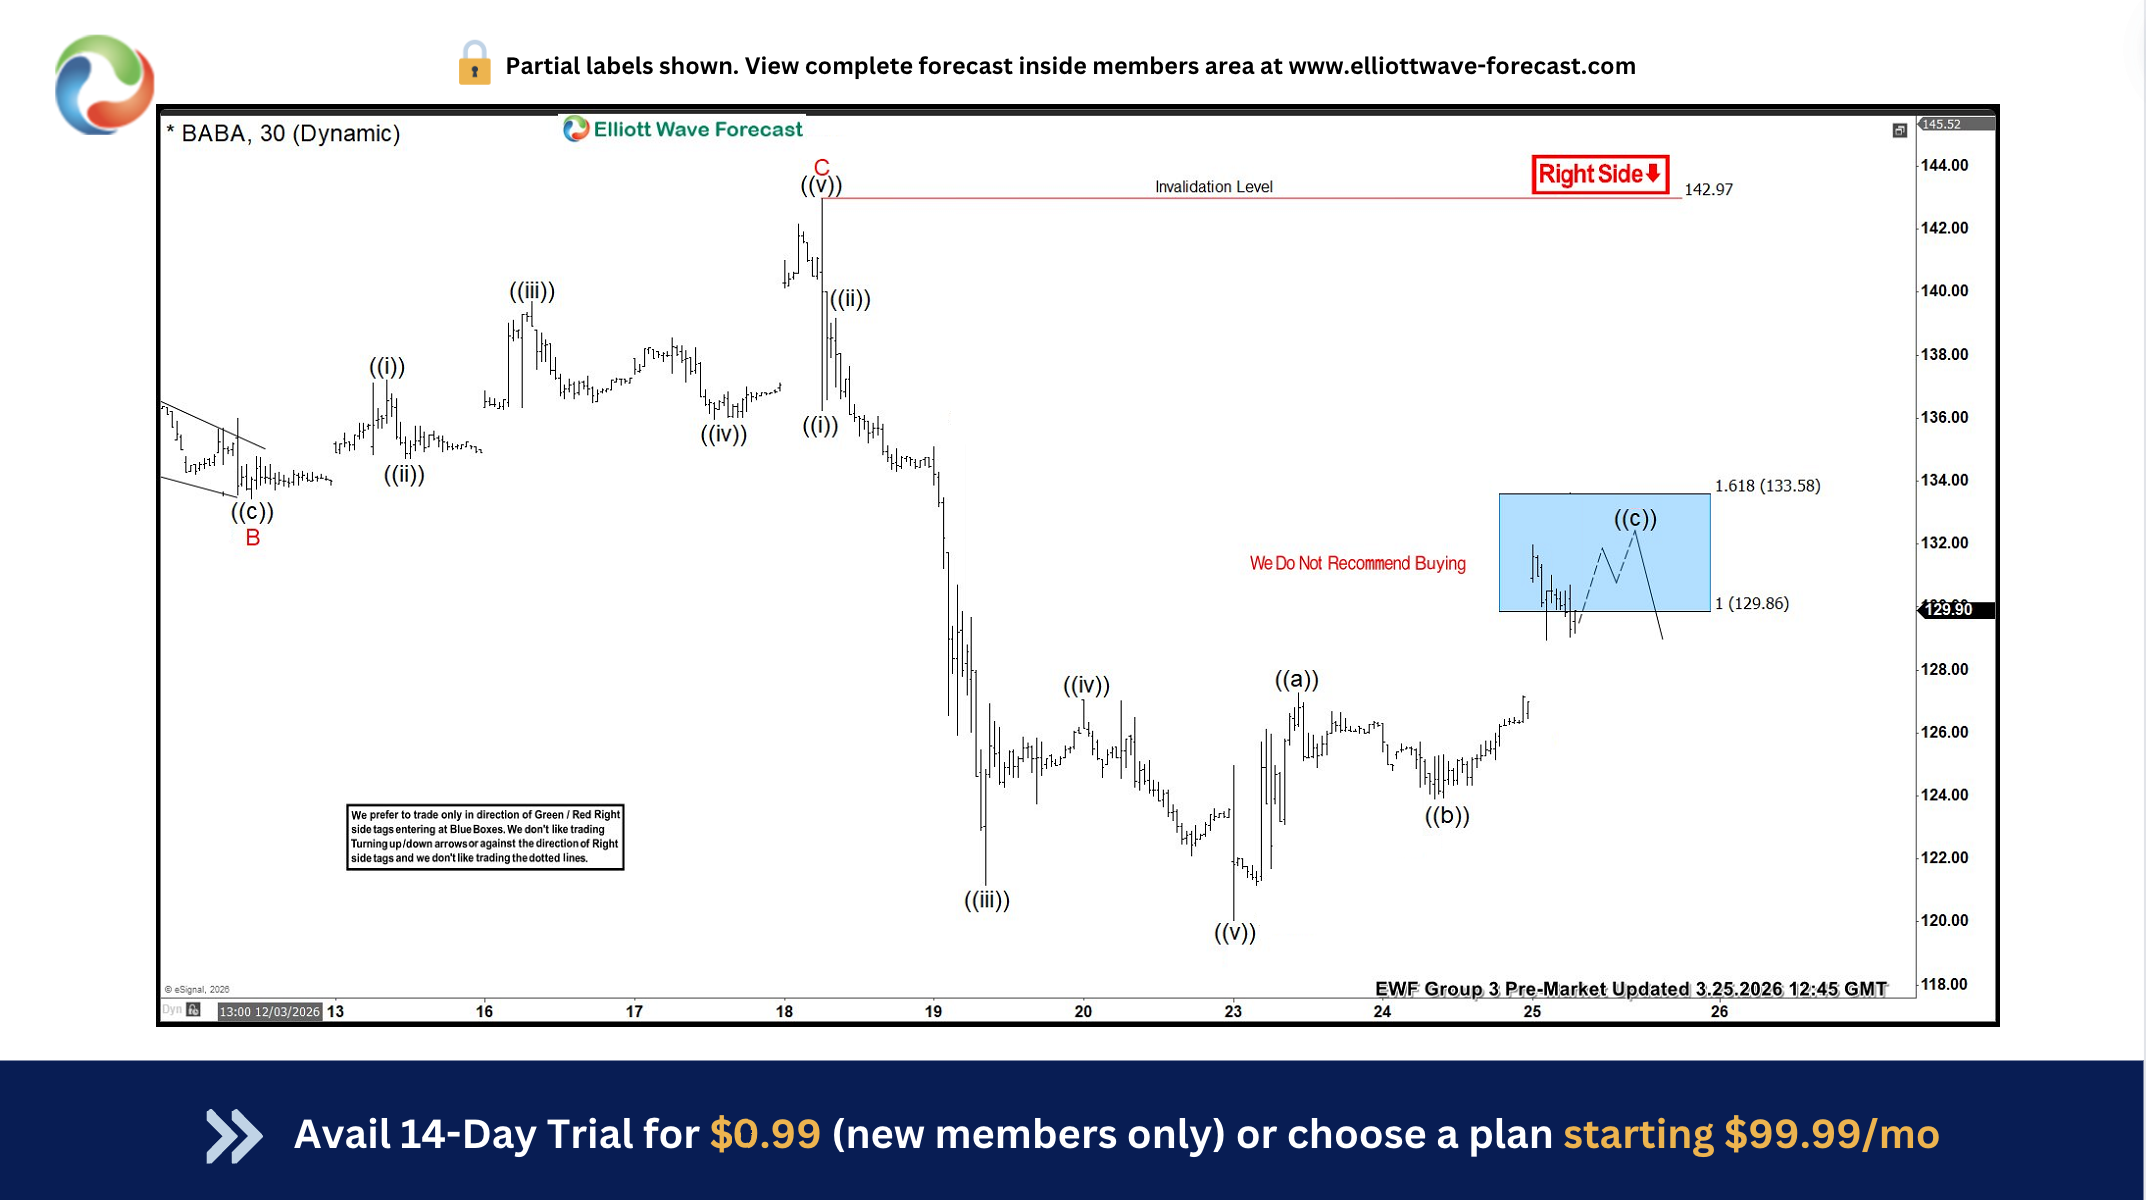
BABA 1-Hour Elliott Wave Chart from 3.25.2026 update. In which, the stock made a bounce towards the blue box area. The internals of that bounce unfolded as zigzag structure where wave ((a)) ended at $127.27 high. Wave ((b)) pullback ended at $123.92 low. And wave ((c)) managed to reach the blue box area at $129.86- $133.58. From there, sellers were expected to appear looking for further downside or a minimum 3-wave reaction lower.
BABA Latest 1-Hour Elliott Wave Chart From 3.31.2026
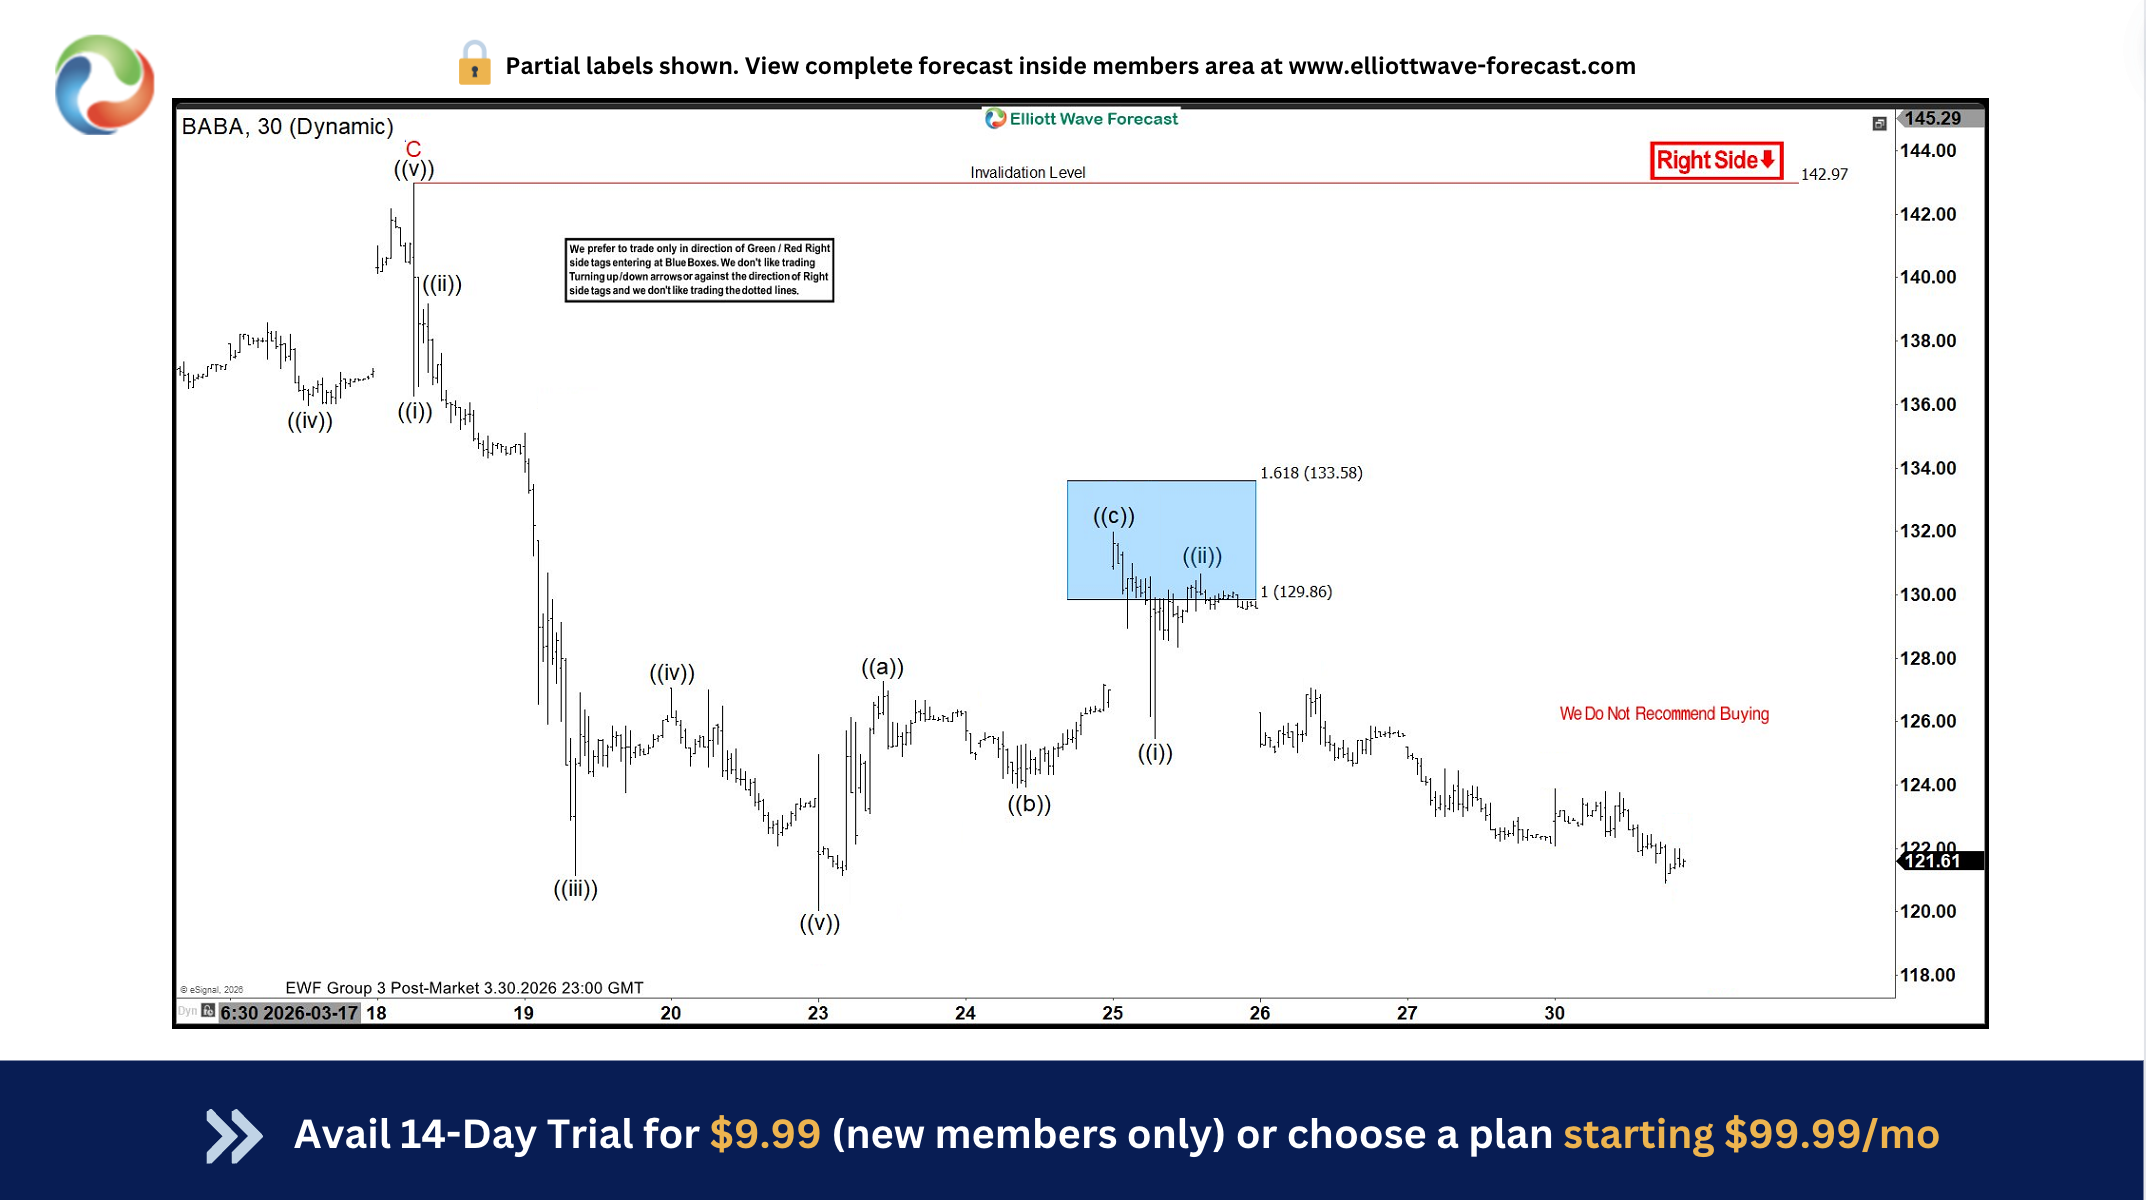
This is the latest 1-Hour view from the 3.30.2026 update. In which the BABA is showing a reaction lower taking place from the blue box area. Allowing shorts to get into a risk-free position shortly after taking the position. However, a break below $121.70 low is needed to confirm the next extension lower & avoid double correction lower.
If you are looking for real-time analysis in BABA along with the other Stocks & ETF’s then join us with a 14-Day Trial for the latest updates & price action.
Success in trading requires proper risk and money management as well as an understanding of Elliott Wave theory, cycle analysis, and correlation. We have developed a very good trading strategy that defines the entry.
Stop loss and take profit levels with high accuracy and allow you to take a risk-free position, shortly after taking it by protecting your wallet. If you want to learn all about it and become a professional trader. Then join our service by taking a Trial.
