
Understanding Elliott Wave Theory is one thing — applying it correctly in live market conditions is where most traders struggle. While many traders can identify basic wave structures, developing the ability to interpret real-time market cycles, corrective patterns, and momentum shifts requires practice, patience, and experience.
This guide explores the practical side of Elliott Wave analysis using interactive charts and real market examples. From zigzag corrections and double three structures to triangle patterns and irregular flats, traders will learn how professional analysts approach wave counting and identify high-probability trading opportunities across Forex, stocks, indices, and cryptocurrency markets.
What Is Elliott Wave Theory?
Elliott Wave Theory is a form of technical analysis that studies recurring market wave structures driven by crowd psychology and investor behavior. Markets tend to move in repetitive cycles consisting of motive waves and corrective waves.
A typical Elliott Wave cycle includes:
- a five-wave impulse trend
- a three-wave correction
By understanding these structures, traders can better identify trend direction, reversal zones, and potential continuation setups.
Why Elliott Wave Analysis Is Difficult In Real Markets
Learning Elliott Wave Theory is relatively straightforward, but applying it successfully in live market conditions is much more challenging. Markets rarely move in perfectly clean structures, and traders often encounter overlapping corrections, shifting momentum, false breakouts, evolving market cycles, and multiple valid wave counts at the same time. Because of this complexity, experienced Elliott Wave analysts rely not only on wave counting, but also on Fibonacci analysis, momentum behavior, sequence analysis, and broader market structure before confirming a trading setup.
Understanding Elliott Wave Corrective Patterns
Corrective structures are one of the most important parts of Elliott Wave Theory because markets spend a large amount of time correcting previous trends.
The most common corrective structures include:
- Zigzags
- Flats
- Triangles
- Double Threes
- Triple Threes
Understanding these elliott wave patterns helps traders determine whether the market is consolidating before continuation or preparing for a larger reversal.
Elliott Wave Zigzag Pattern Explained
The Elliott Wave Zigzag is one of the most popular corrective structures. It follows a 5-3-5 internal structure labeled as ABC.
In a zigzag:
- wave A forms in 5 waves
- wave B forms in 3 waves
- wave C forms in 5 waves
Why Zigzags Matter
Zigzag patterns are among the most common continuation corrections in Elliott Wave Theory and frequently appear during strong trending markets. Traders often use these structures to identify pullback opportunities within the larger trend, especially when combined with Fibonacci retracement levels to locate potential support or resistance zones.
Understanding Elliott Wave Double Three Structures
The Double Three pattern is a more complex corrective structure often labeled as WXY. It combines two corrective structures connected by an intervening X wave.
In the NVDA chart example, the market developed a 7-swing correction structure while unfolding in a larger degree wave IV correction. The stock reached the blue box reaction area where buyers were expected to appear.
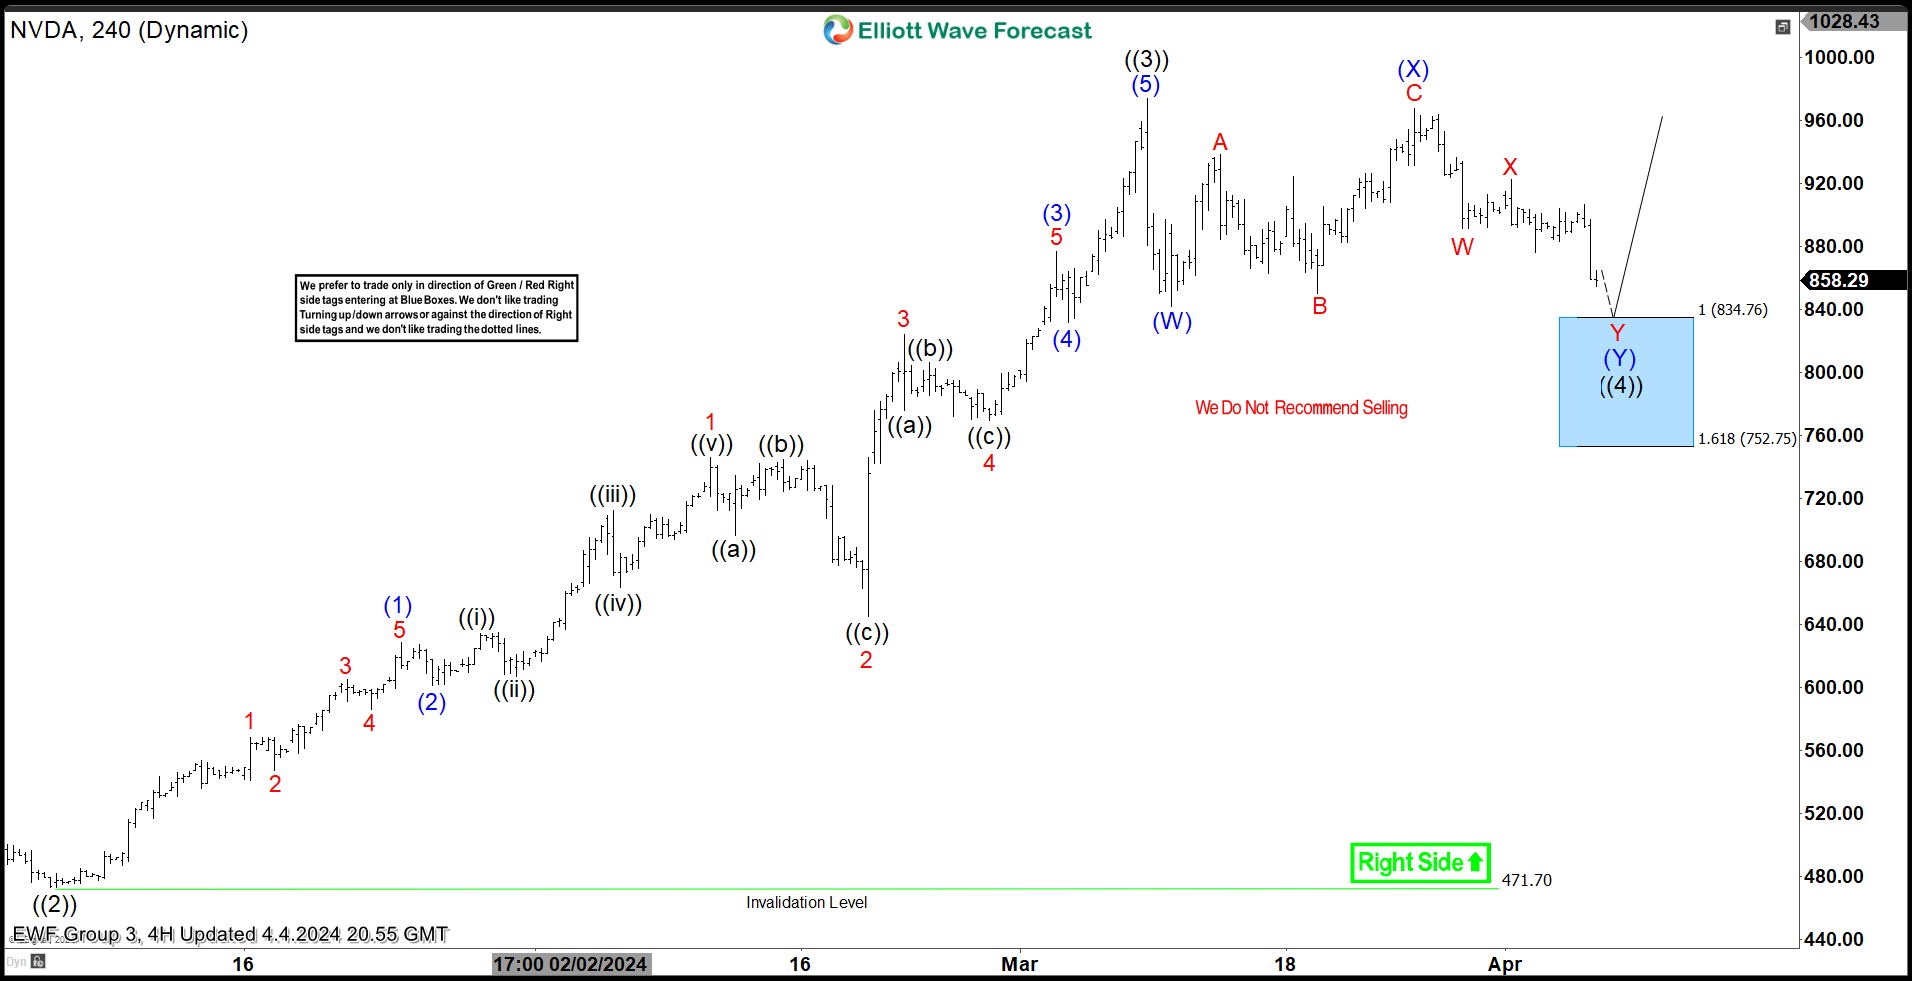 Double Three structures are particularly important in Elliott Wave analysis because they often create prolonged sideways consolidations that can confuse traders and delay trend continuation. These patterns frequently trap trend-following traders, extend the duration of corrections, and appear regularly in modern financial markets where price action tends to become increasingly complex.
Pro Tip
Many traders incorrectly assume corrections end after a simple ABC structure. In reality, markets often extend into WXY or even WXYXZ combinations.

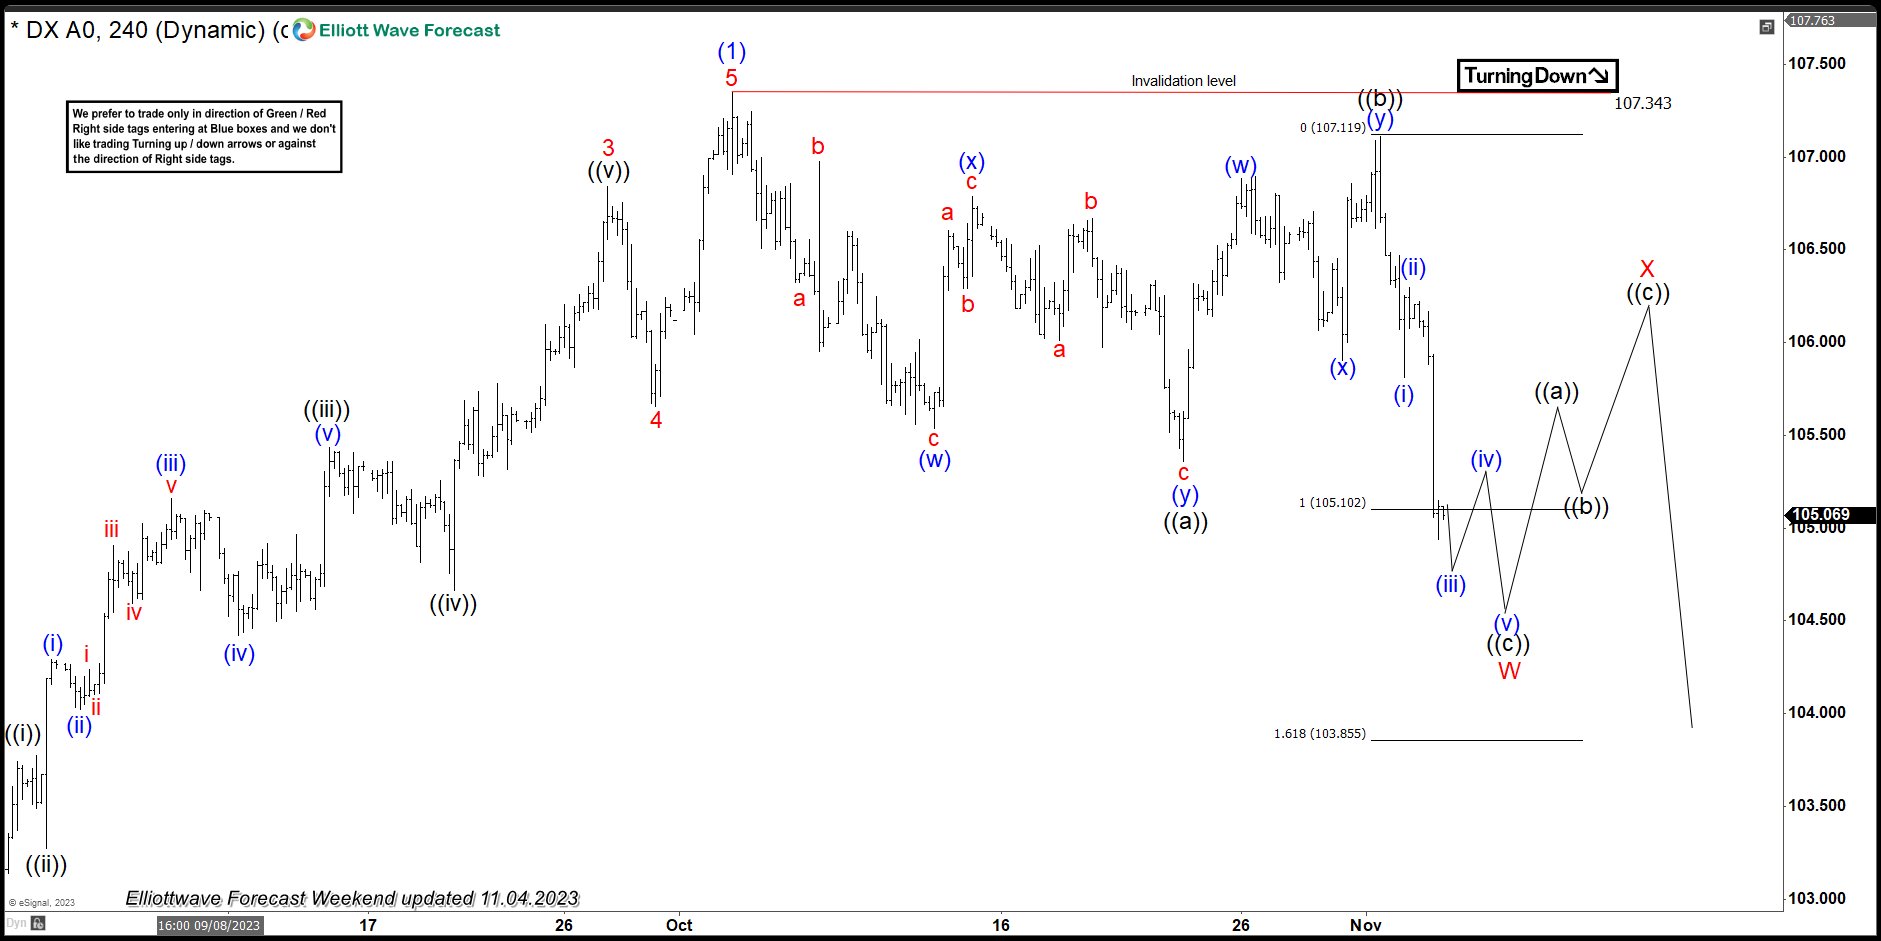
Irregular Flat Patterns In Elliott Wave Theory
Irregular Flats are another advanced corrective structure in Elliott Wave analysis. These patterns typically follow a 3-3-5 internal structure.
In an irregular flat:
- wave B exceeds the start of wave A
- wave C extends strongly beyond wave A termination
The Dollar Index example highlighted how irregular flats can create momentum divergence and false breakout behavior before the market completes a corrective cycle.
 Why Traders Monitor Flat Patterns
Flat patterns are useful because they often help traders identify exhaustion behavior and detect failed breakouts during corrective market conditions. These structures commonly appear in sideways markets and can frequently lead to sharp reversals once the correction is complete.
Elliott Wave Triangle Patterns
Triangles are sideways corrective structures made up of five overlapping swings forming a 3-3-3-3-3 sequence.
Why Triangle Patterns Matter
Triangle patterns are important because they often signal market consolidation before the next major directional move begins. These structures can help traders avoid false entries, identify potential breakout setups, and define clearer invalidation levels during corrective market conditions.
The Importance Of Wave Counting
Wave counting remains one of the most important skills in Elliott Wave analysis because it helps traders understand the current market structure and anticipate potential future price movement. Professional traders focus on identifying internal subdivisions, validating impulsive structures, recognizing corrective sequences, monitoring momentum behavior, and confirming Fibonacci relationships to improve the accuracy of their analysis. Accurate wave counting allows traders to determine whether the market is trending, correcting, exhausting, or preparing for continuation.
Why Multi-Timeframe Analysis Matters
One of the biggest mistakes beginner Elliott Wave traders make is relying on only one timeframe when analyzing the market. Professional analysts combine higher timeframe trend direction, medium timeframe structure, and lower timeframe execution to create more reliable trading setups and reduce the risk of trading against the dominant trend. For example, weekly charts help identify the broader market direction, daily charts define the main structure, and intraday charts are often used to refine entries and manage trade timing.
Mastering Elliott Wave Application
Developing Elliott Wave proficiency takes time. Most traders begin by identifying simple wave structures but struggle when markets become complex.
Over time, traders improve by:
- studying historical charts
- tracking market cycles
- reviewing invalidated counts
- understanding momentum behavior
- practicing real-time analysis
Eventually, Elliott Wave Theory becomes less about rigid labeling and more about understanding market behavior and probability-based forecasting.
Experienced traders understand that Elliott Wave is not a mechanical signal system. It is a structured framework used to interpret market psychology and price development.
To improve Elliott Wave accuracy, traders often combine wave counting with technical indicators, Fibonacci analysis, and momentum confirmation tools that help validate market structure and identify high-probability trading setups.
Common Elliott Wave Mistakes
Many traders struggle with Elliott Wave analysis because they force wave counts, ignore internal structures, overlook momentum confirmation, trade without proper invalidation levels, or rely on only one timeframe. Successful Elliott Wave trading requires flexibility, discipline, and the ability to adapt as new price action develops and market conditions evolve.
Practical Elliott Wave Trading Tips
Focus On Market Structure
Do not force trades simply because a pattern appears incomplete.
Use Fibonacci Analysis
Combine wave counts with Fibonacci retracements and extensions.
Monitor Momentum
Divergence often helps confirm exhaustion setups.
Trade With Trend Alignment
Higher timeframe trend direction significantly improves probabilities.
Be Flexible
Alternative counts are part of Elliott Wave analysis. Markets evolve constantly.
To better understand corrective market behavior, traders should also study the importance of three-wave structures in Elliott Wave analysis, as these patterns frequently appear during market corrections and trend continuations.
Final Thoughts
Elliott Wave Theory remains one of the most advanced methods for understanding market structure and price behavior. While mastering Elliott Wave analysis takes time, traders who combine wave counting with momentum analysis, Fibonacci relationships, and multi-timeframe structure often develop a deeper understanding of market cycles and trading opportunities.
At Elliott Wave Forecast, traders gain access to real-time Elliott Wave analysis, blue box setups, market forecasts, and professional trading insights across Forex, stocks, commodities, and cryptocurrency markets.
Start exploring live market analysis today with the Elliott Wave Forecast community and access the $0.99 trial.
FAQs
What is the most common corrective pattern in Elliott Wave Theory?
The zigzag pattern is one of the most common corrective structures and follows a 5-3-5 internal sequence.
What is a Double Three pattern?
A Double Three is a complex corrective structure labeled WXY that combines two corrective patterns connected by an X wave.
Why is Elliott Wave difficult to apply in real time?
Live markets constantly evolve, which means wave counts can change as new price action develops.
What is an Elliott Wave Triangle?
An Elliott Wave Triangle is a sideways corrective structure made of five overlapping corrective swings.
Can Elliott Wave Theory be used in Forex and crypto markets?
Yes. Elliott Wave Theory works across Forex, stocks, commodities, indices, and cryptocurrency markets.
Why is multi-timeframe analysis important?
It helps traders align lower timeframe setups with the larger market trend for higher-probability trading opportunities.


