Visa (V) shows strong momentum heading into next quarter. Analysts expect higher revenue and EPS, supported by rising payment volumes and steady cross‑border activity. Moreover, Visa keeps beating estimates, which strengthens confidence in continued earnings growth. Stablecoin-linked payments also expand quickly, adding a new growth driver.
Next quarter may deliver another solid performance. Estimates call for EPS near $3.21–$3.22 and revenue above $11.3B, according to analyst projections. Transaction volume trends remain positive, and value‑added services grow fast. Therefore, Visa enters the next quarter with strong fundamentals and improving sentiment.
Elliott Wave Outlook: VISA (V) Weekly Chart January 2026
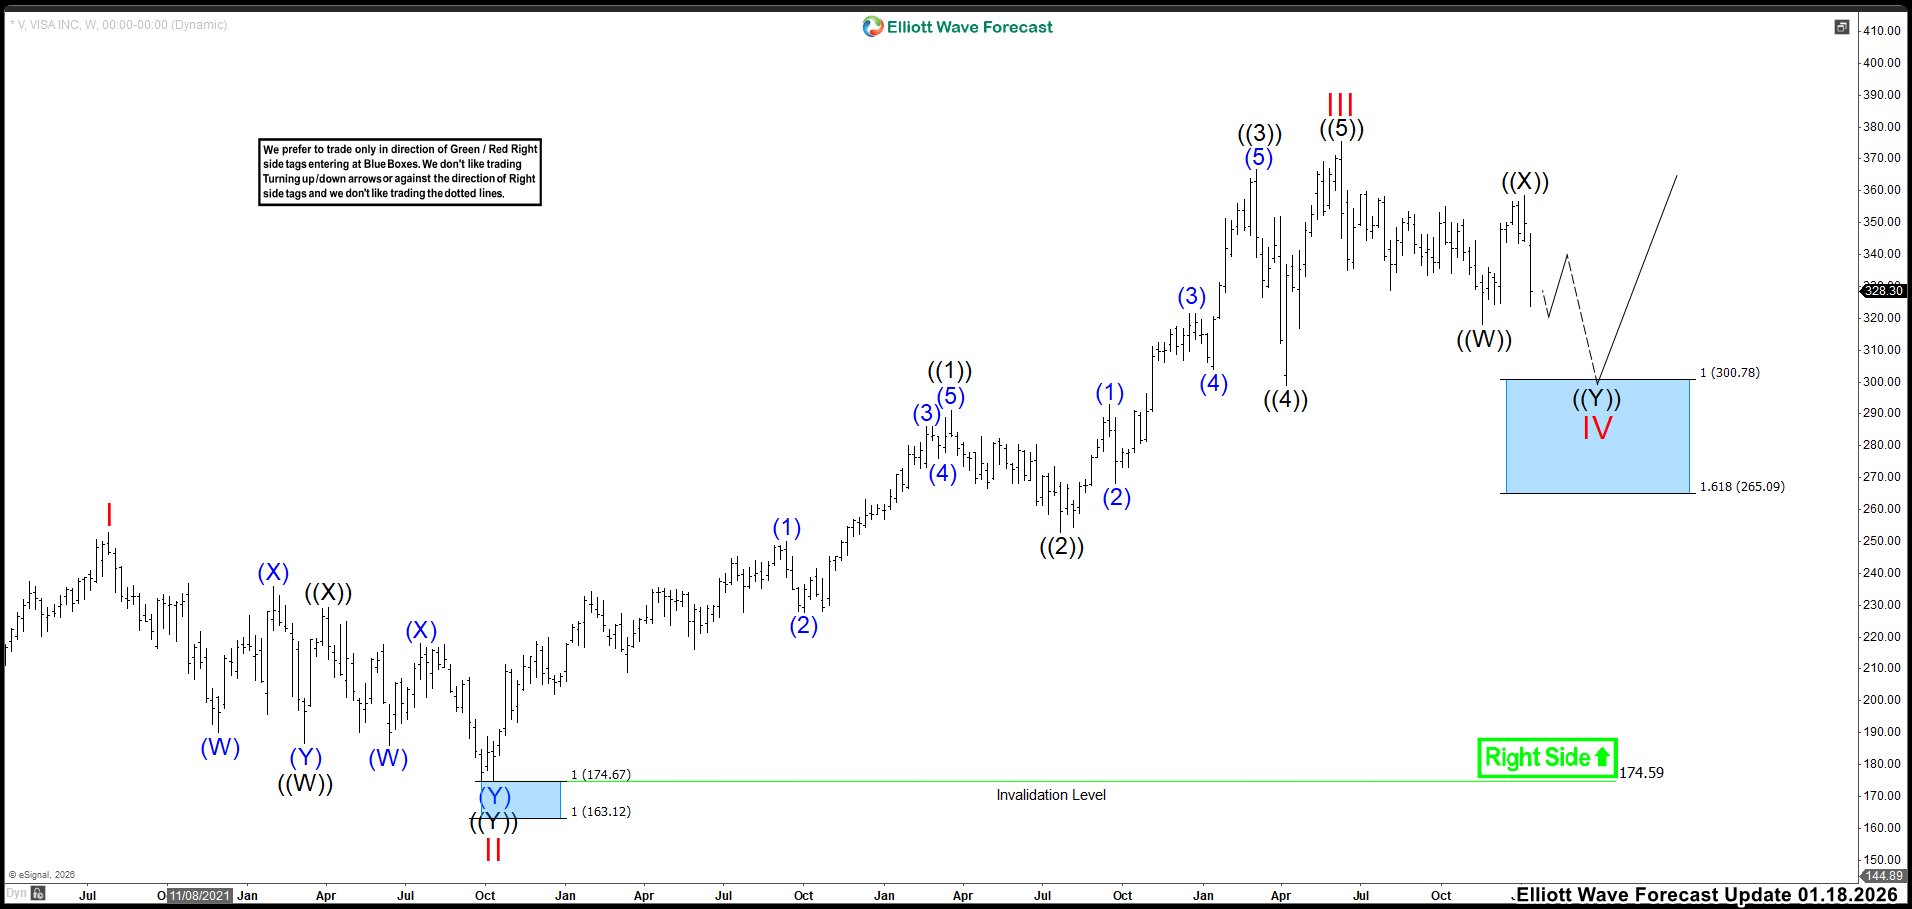
In the last update, we noted that the market had broken below $328.70 in November, which indicated that wave IV had already started. Because of that break, we labeled the structure as a double correction. Wave ((W)) defined the November low, wave ((X)) defined the January 2026 high, and we anticipated three additional waves lower to complete the pattern before the bullish trend resumed.
We expected the next bounce to unfold as a corrective move, allowing one more leg down into the blue box at 300.78–265.09. To confirm this view, the market needed to break the November low. That break would have created a strong opportunity to buy Visa (V) again.
(If you want to learn more about Elliott Wave Principle, please follow these links: and .)
Elliott Wave Principle Behind the Market Structure
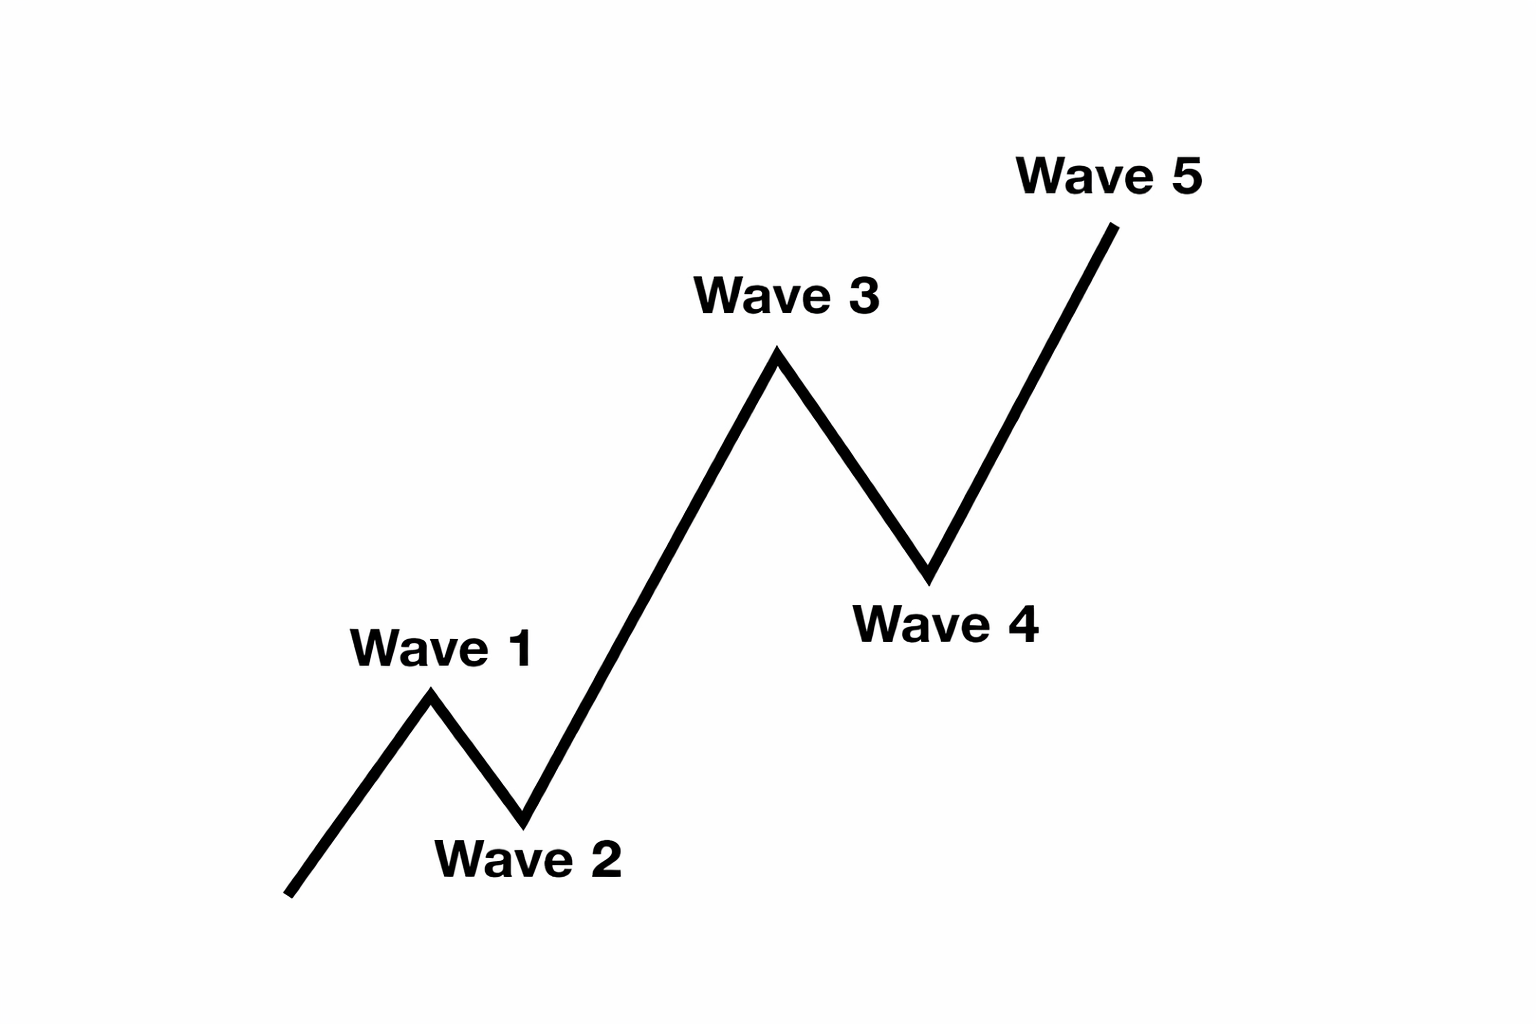
Impulse
An impulse is a clean 5‑wave pattern that drives the trend forward.
- Waves 1‑3‑5 are strong and directional.
- No overlap between waves 1 and 4.
- Wave 3 is usually the strongest.
- Structure is clear, with increasing momentum.
Elliott Wave Outlook: VISA (V) Daily Chart May 2026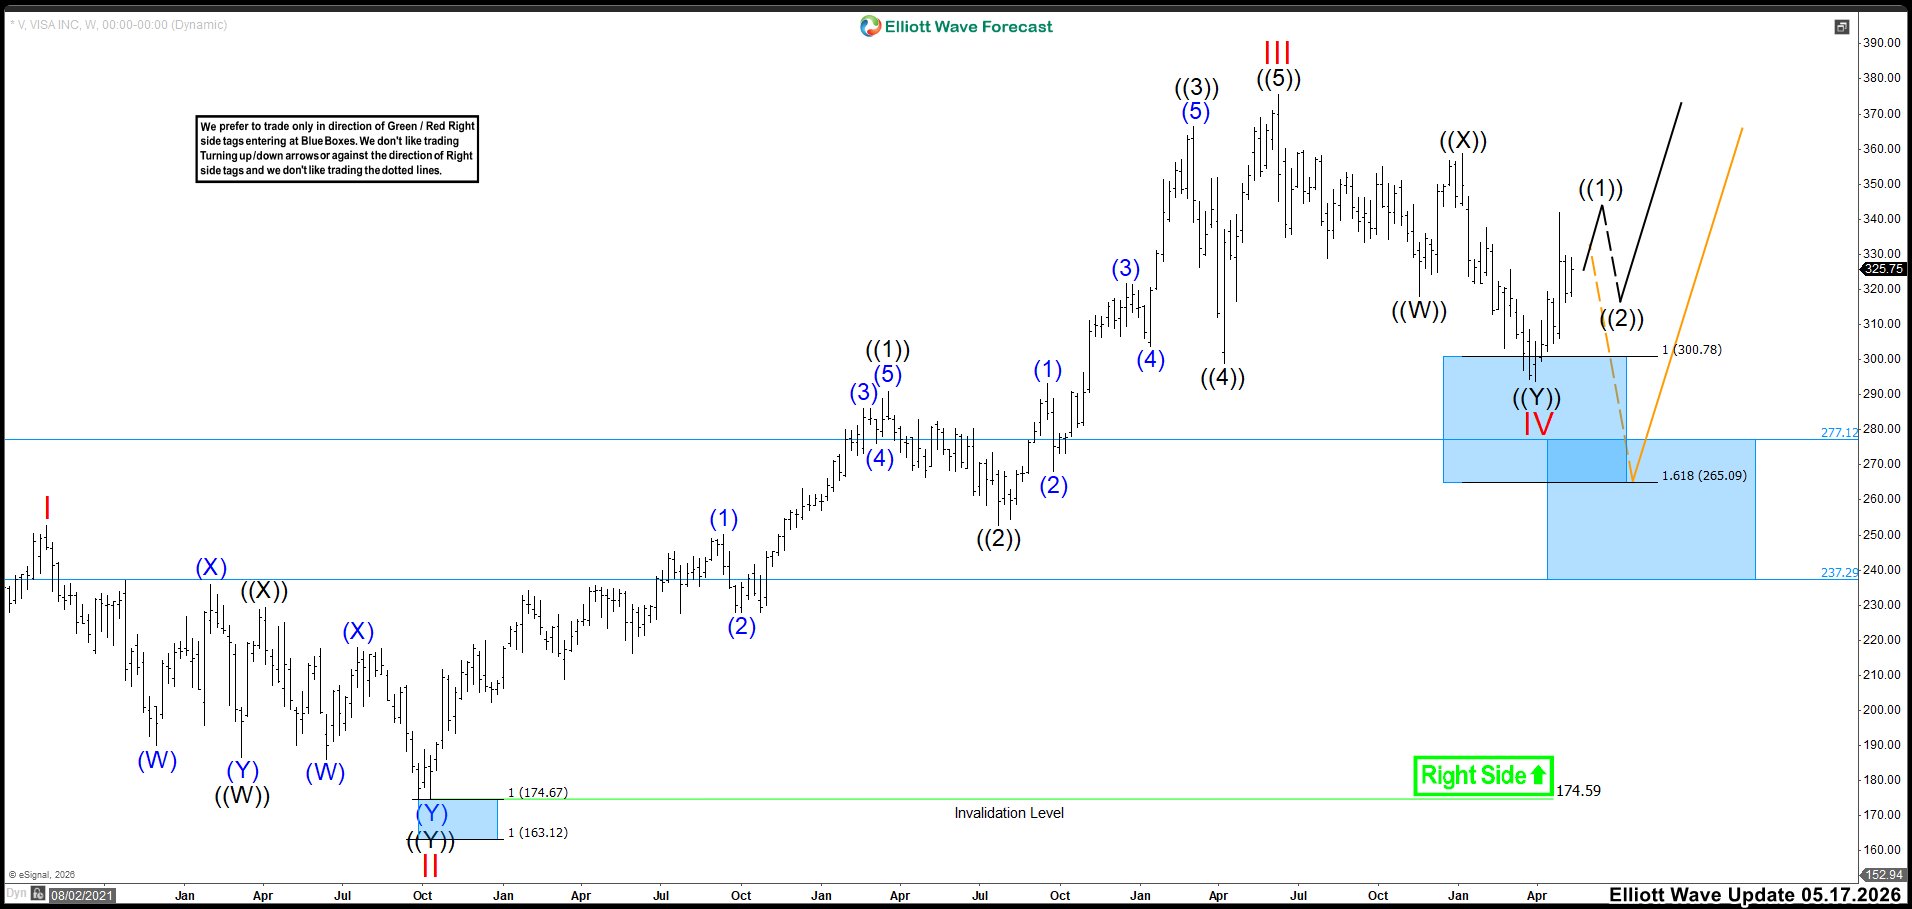
In this new update, we saw the market react higher from the blue box as expected. However, the price action in Visa remained unclear, and the market needed to break key levels to define the next scenarios. First, Visa needed to break above the 342.06 high to complete five waves up from the 293.76 low and form an impulsive structure as wave ((1)). In that case, we expected the low labeled as wave IV to hold during a pullback as wave ((2)), followed by a continuation higher.
But if the market failed to break that high, it could continue lagging in price and potentially move lower. In that scenario, the market could break below the 293.76 low, following the orange path, and extend toward the 277.17–237.29 area to correct the cycle from the 2022 low. If that happened, the market would have offered a strong opportunity to buy Visa shares again.
Transform Your Trading with Elliott Wave Forecast!
Ready to take control of your trading journey? At Elliott Wave Forecast, we provide the tools you need to stay ahead in the market:
Blue Boxes: Stay ahead in the market with fresh 1-hour charts updated four times daily, daily 4-hour charts on 78 instruments, and precise Blue Box zones that highlight high-probability trade setups based on sequences and cycles.
Live Sessions: Join our daily live discussions and stay on the right side of the market.
Real-Time Guidance: Get your questions answered in our interactive chat room with expert moderators.
🔥 Special Offer: Start your journey with a 14-day trial for only $0.99. Gain access to exclusive forecasts and Blue Box trade setups. No risks, cancel anytime by reaching out to us at support@elliottwave-forecast.com.
💡 Don’t wait and get a DISCOUNT for any plan!
Click in the next link, go to Home Chat and ask for a flat discount code saying that you saw this in Luis’ Blog: 🌐


