Elliott Wave analysis remains one of the most effective ways to understand market structure, identify market cycles, and forecast future price movement. However, experienced traders know that wave counting alone is rarely enough. The best Elliott Wave traders combine wave structure with technical indicators, momentum analysis, Fibonacci ratios, and multi-timeframe confirmation toDiscover the top 10 Elliott Wave tools and technical indicators traders use in 2026, including Fibonacci Retracement, RSI Divergence, Elliott Wave Oscillator, and Blue Boxes to identify high-probability trading setups. identify high-probability trading setups.
If you’ve been tracking markets like the S&P 500, Gold, Bitcoin, or the Nikkei lately, you already know how quickly momentum shifts can invalidate weak setups. That’s why traders in 2026 are relying on a combination of modern charting tools and proven Elliott Wave principles to stay ahead of market moves.
In this guide, we’ll break down the top 10 essential tools and indicators that help traders improve Elliott Wave accuracy, confirm wave counts, and identify potential reversal zones more effectively.
Why Elliott Wave Traders Need Additional Tools
Elliott Wave Theory provides a framework for understanding crowd psychology and recurring market patterns. But in live market conditions, traders often face:
- multiple valid wave counts
- overlapping corrective structures
- false breakouts
- momentum traps
This is where technical indicators and confirmation tools become essential. The right tools can help traders:
- validate Elliott Wave counts
- improve trade timing
- reduce false signals
- identify momentum shifts
- improve risk management
Top 10 Elliott Wave Tools Comparison
| Tool / Indicator | Primary Purpose | Best Use Case | Key Elliott Wave Benefit |
| 1. Fibonacci Extension Tools | Price target projection | Wave 3 & Wave 5 targets | Identifies high-probability extension zones |
| 2. Elliott Wave Oscillator (EWO) | Momentum confirmation | Wave 3 identification | Confirms impulse strength |
| 3. RSI (Relative Strength Index) | Divergence detection | Wave 5 exhaustion | Helps identify reversals |
| 4. Proprietary Blue Boxes | High-frequency inflection zones | Corrective pullbacks | Improves reaction-area precision |
| 5. Correlation Tables | Cross-market confirmation | Trend validation | Confirms or weakens wave counts |
| 6. Ichimoku Clouds | Trend confirmation | Trending markets | Filters counter-trend setups |
| 7. Volume Profile | Institutional positioning analysis | Wave 4 support/resistance | Identifies strong reaction zones |
| 8. Multi-Timeframe Analysis Tools | Trend alignment | Higher-probability setups | Aligns lower & higher timeframe structure |
| 9. Stochastic Momentum Index (SMI) | Momentum exhaustion analysis | Corrective structures | Improves reversal timing |
| 10. Journaling Software | Performance tracking | Trade review & improvement | Improves wave count accuracy over time |
1. Fibonacci Extension Tools
Fibonacci extensions remain one of the most important tools in Elliott Wave analysis. Traders use them to project future price targets, especially during impulsive market moves.
The 1.618 Fibonacci extension is particularly important because Wave 3 often extends toward this level during strong trending conditions.
Why It Matters
- Helps project Wave 3 targets
- Identifies potential Wave 5 completion zones
- Improves risk-to-reward planning
- Confirms impulse strength
Pro Tip
When Wave 3 extends aggressively beyond the 1.618 level, traders should monitor momentum carefully because extended fifth waves and exhaustion moves often follow.
DAX Elliott Wave 1 Hour Chart 05.23.2024
DAX remains bullish overall and is currently undergoing a corrective Elliott Wave pullback before potentially resuming higher. Analysts expect the index to find support within the blue box Fibonacci extension zone, where buyers may re-enter and push prices toward new highs while managing risk through breakeven adjustments and invalidation levels.
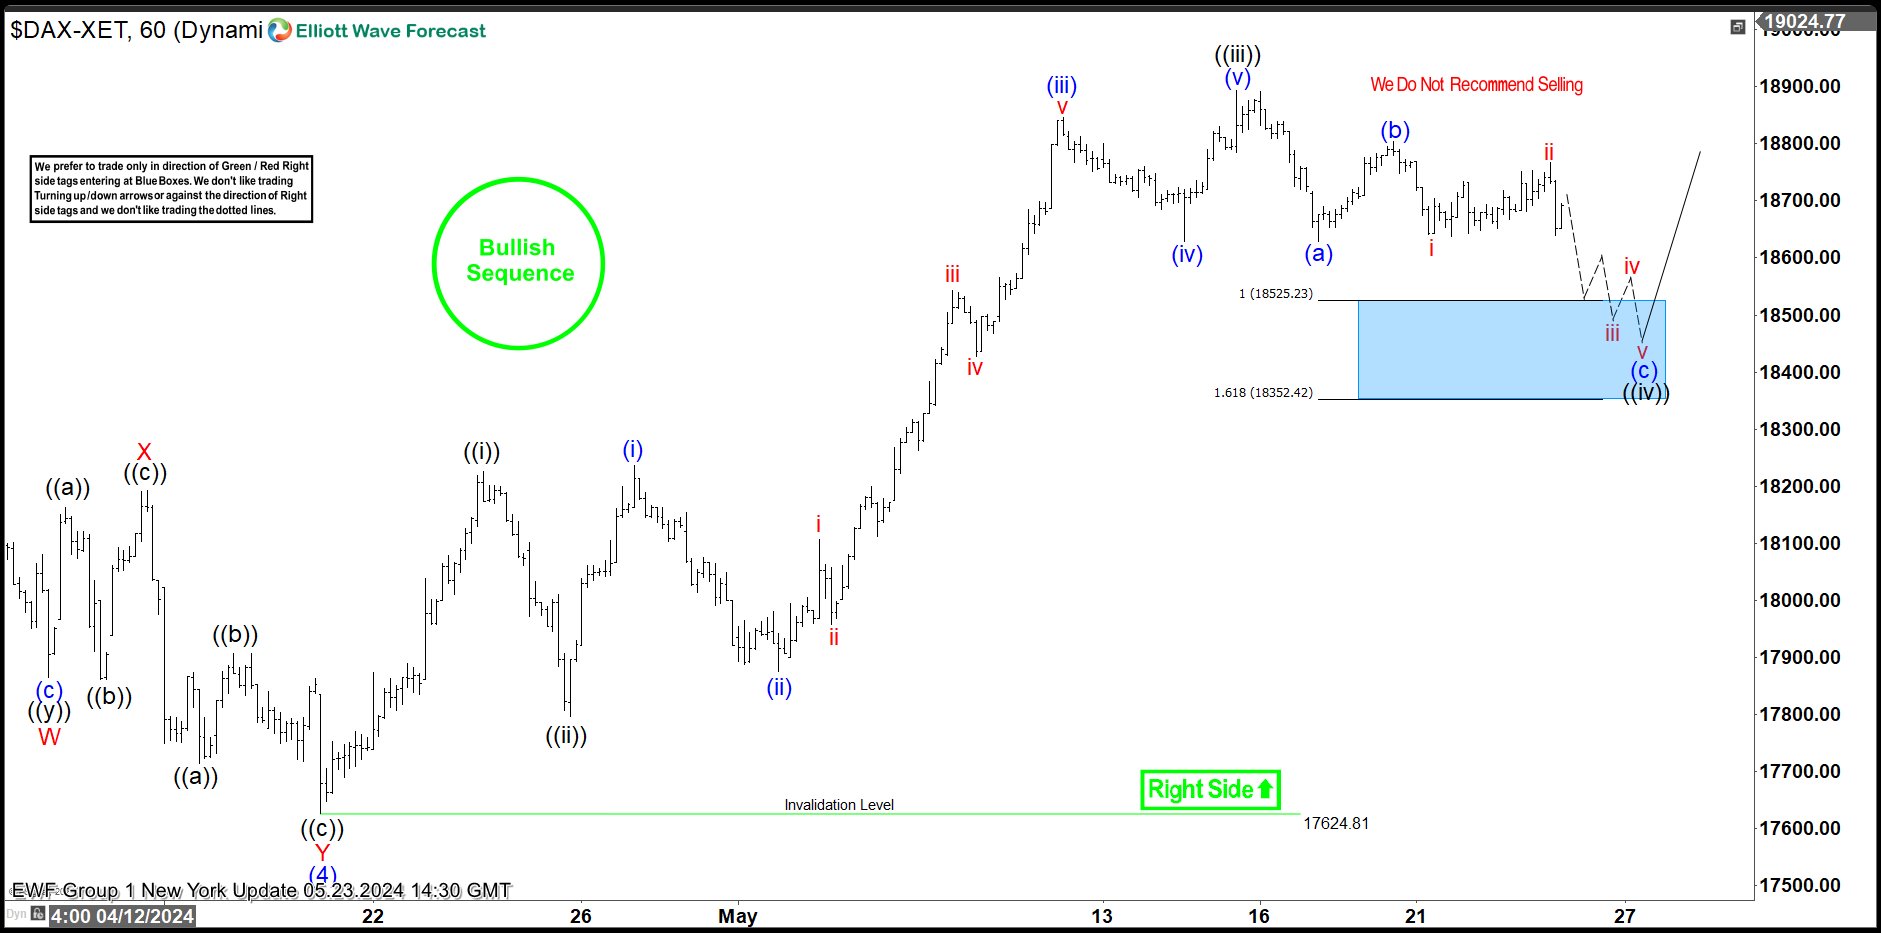
At Elliott Wave Forecast, Fibonacci extension analysis is frequently combined with sequence analysis and blue box areas to identify high-probability reaction zones.
2. Elliott Wave Oscillator (EWO)
The Elliott Wave Oscillator is widely used to identify momentum shifts within Elliott Wave structures. It is especially useful for detecting Wave 3, which is typically the strongest and most explosive wave in an impulse sequence.
Why Traders Use It
- Confirms Wave 3 acceleration
- Measures trend strength
- Identifies weakening momentum
- Helps differentiate corrective vs impulsive price action
Pro Tip
One of the clearest Wave 3 signals occurs when the EWO creates a strong momentum expansion while price breaks above previous highs with increasing separation from the zero line.
3. RSI (Relative Strength Index)
RSI remains one of the most effective indicators for identifying Wave 5 divergence setups.
In many Elliott Wave structures, Wave 5 pushes price into a new high while RSI fails to confirm the move. This bearish divergence often signals weakening momentum and an increased probability of reversal.
Why RSI Divergence Works
- Identifies momentum exhaustion
- Confirms potential trend reversal
- Helps validate Wave 5 completion
- Improves entry timing
Pro Tip
Many traders focus only on RSI overbought conditions, but divergence itself is often far more important than the actual RSI level.
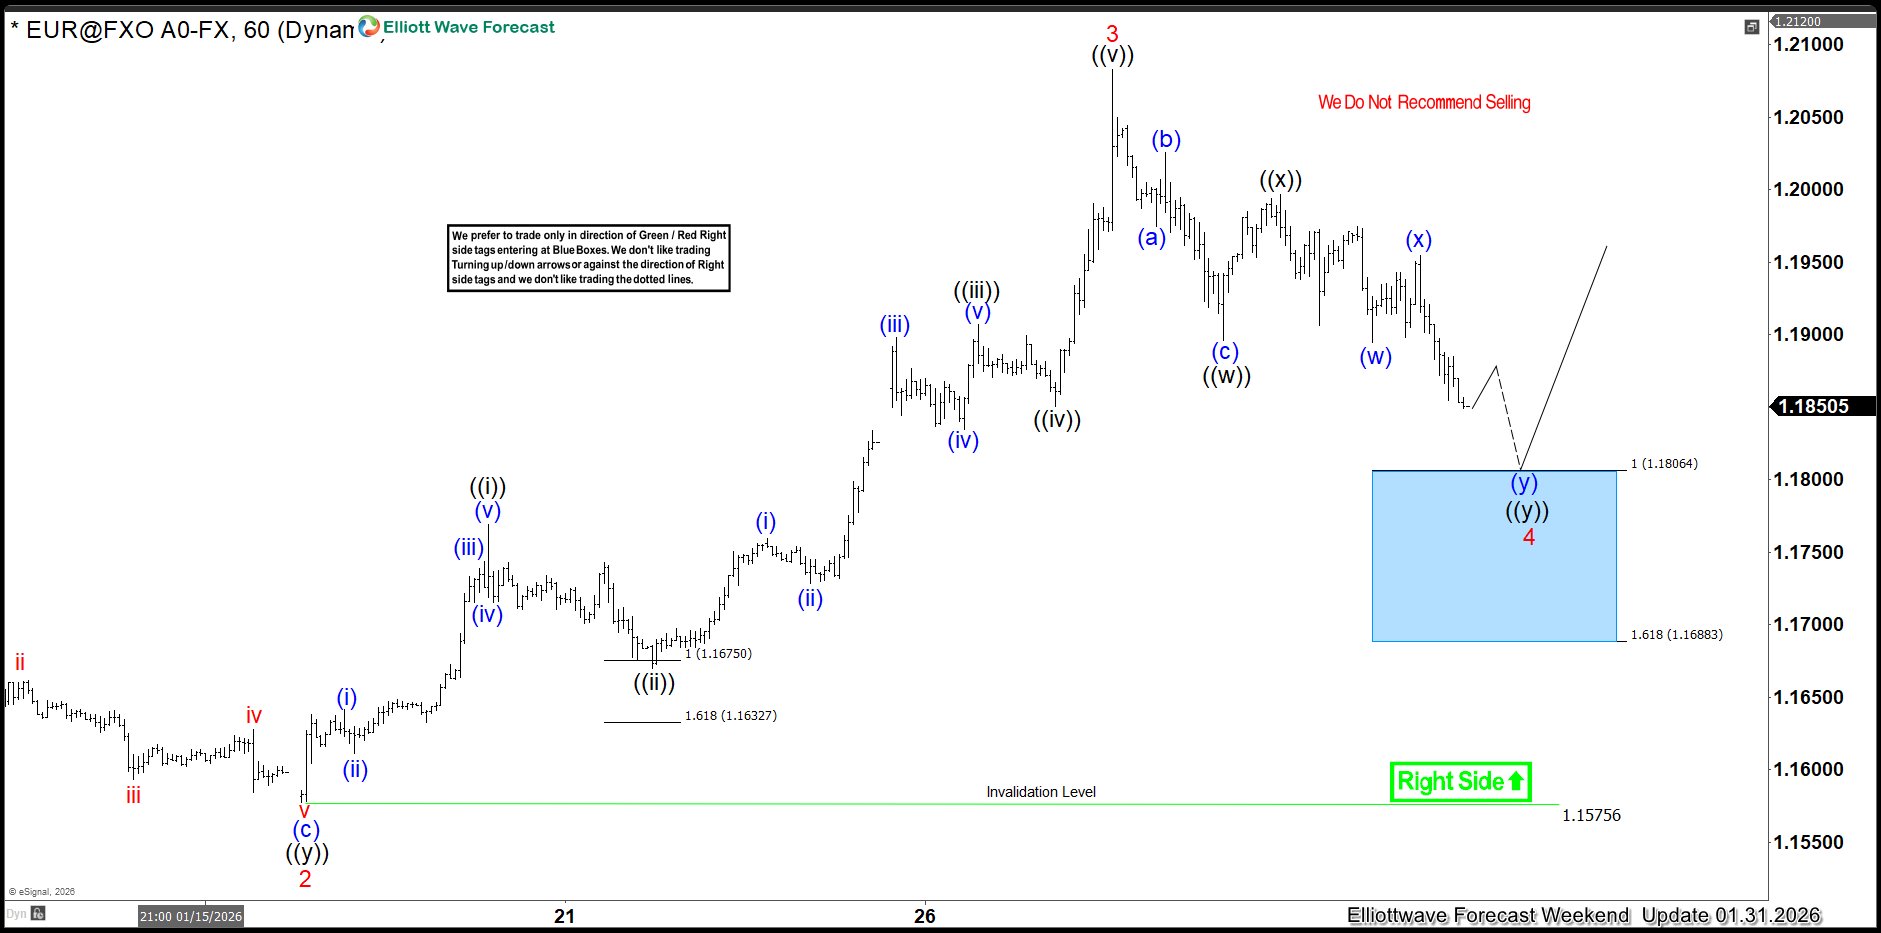
EURUSD 1-Hour Elliott Wave Chart From 1.31.2026
The chart showed a completed Wave 3 rally followed by a corrective Wave 4 pullback forming a double three Elliott Wave pattern. Analysts expected buyers to enter within the blue box support zone, leading to either a new high or at least a short-term recovery bounce.
 4. Proprietary Blue Boxes
Blue Boxes are one of the signature tools used at Elliott Wave Forecast to identify high-frequency inflection areas where markets are statistically likely to react.
These zones are created using:
- Fibonacci extensions
- sequence analysis
- swing relationships
- market structure
Why Traders Use Blue Boxes
- Identifies high-probability reaction areas
- Helps traders buy pullbacks in bullish trends
- Improves timing during corrective structures
- Creates clearer invalidation levels
Pro Tip
The best blue box setups occur when higher timeframe trend direction aligns with lower timeframe corrective structures.
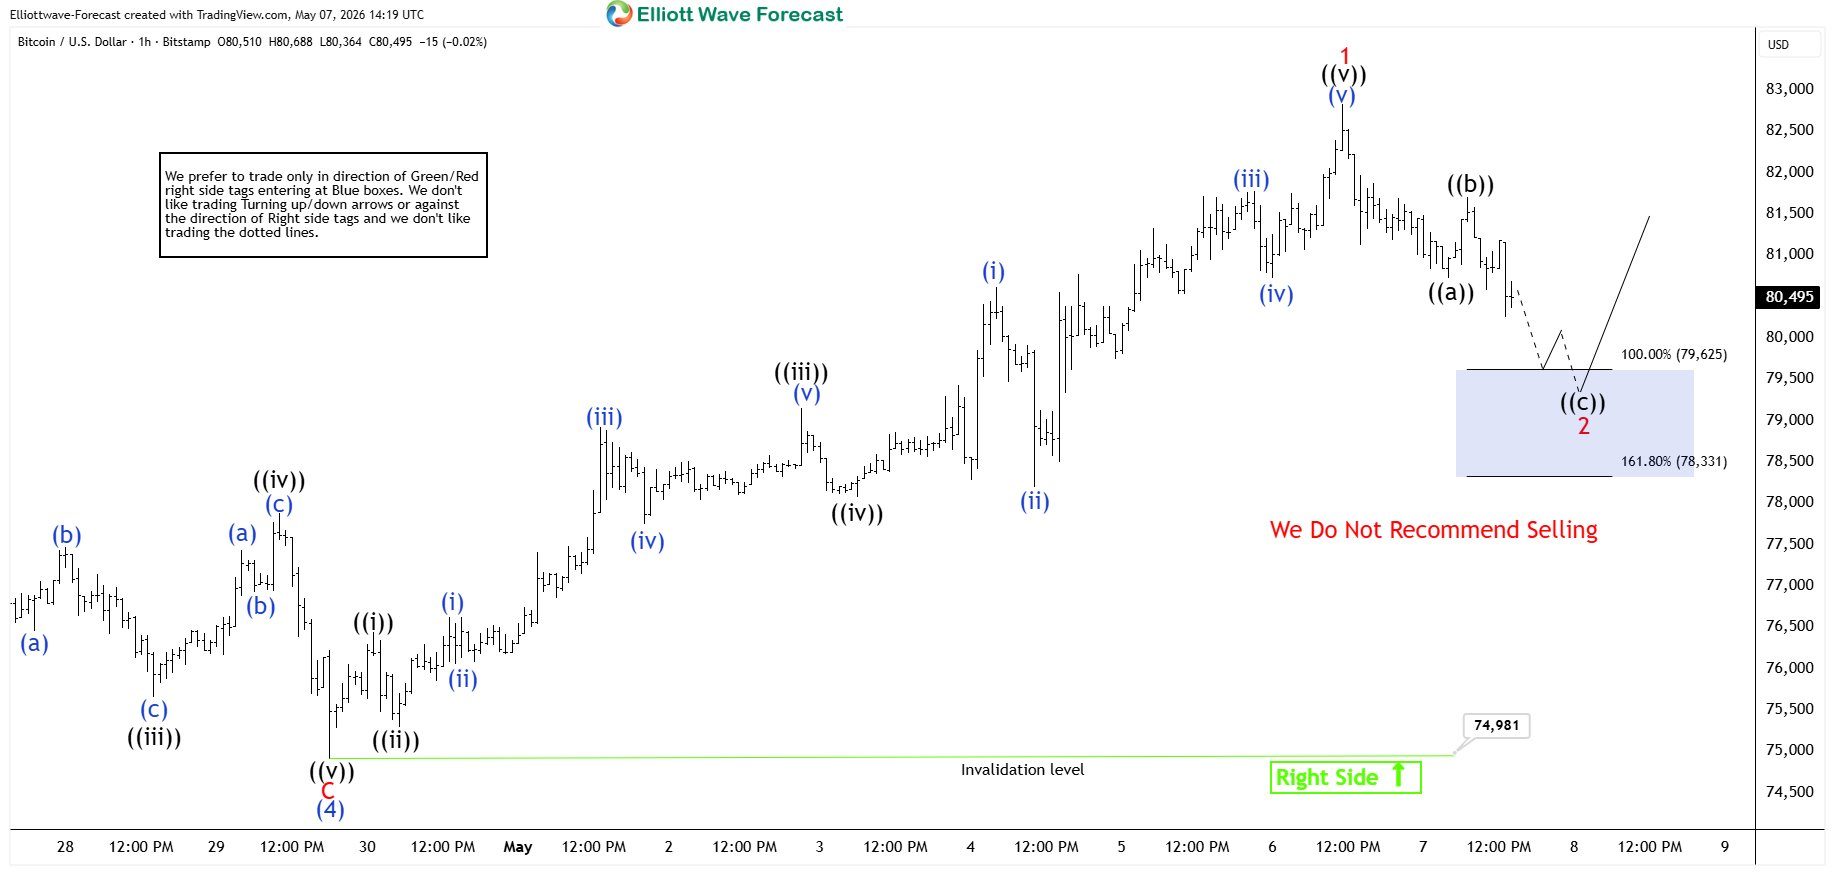
Bitcoin 1-Hour Elliott Wave Chart From 5.07.2026
Bitcoin completed an initial bullish Wave 1 rally before entering a corrective Wave 2 pullback structured as an Elliott Wave zigzag pattern. Analysts expected buyers to react within the blue box support area, potentially triggering the next upward move or at least a short-term recovery bounce.Bitcoin completed an initial bullish Wave 1 rally before entering a corrective Wave 2 pullback structured as an Elliott Wave zigzag pattern. Analysts expected buyers to react within the blue box support area, potentially triggering the next upward move or at least a short-term recovery bounce.
 5. Correlation Tables
Correlation analysis has become increasingly important in 2026 as global markets move more interconnectedly.
Traders now monitor:
- Dollar Index vs Gold
- Bonds vs Stocks
- Nasdaq vs Bitcoin
- Yen pairs vs Risk Sentiment
Why Correlations Matter
Second-market confirmation can strengthen or weaken an Elliott Wave count.
For example:
- bullish equities + weak USD often support risk-on wave structures
- strong bond rallies may confirm defensive corrective environments
Pro Tip
If your Elliott Wave count suggests bullish continuation but correlated markets disagree, it’s usually a warning sign to reduce position size or wait for confirmation.
6. Ichimoku Clouds
Ichimoku Clouds are powerful for trend confirmation and market context.
While many traders use Ichimoku as a standalone strategy, Elliott Wave traders use it differently — primarily to confirm trend direction and momentum alignment.
Benefits
- Confirms trend strength
- Identifies support/resistance zones
- Improves higher timeframe bias
- Helps filter corrective noise
Pro Tip
When Wave 3 develops above a bullish cloud structure with strong momentum expansion, continuation probability increases significantly.
7. Volume Profile
Volume Profile has become increasingly popular among professional traders because it reveals where institutional activity is concentrated.
Wave 4 corrections often retrace toward high-volume nodes before continuation higher.
Why It Works
- Identifies support/resistance zones
- Reveals institutional positioning
- Improves pullback entries
- Confirms acceptance/rejection areas
Pro Tip
Watch for Wave 4 pullbacks into high-volume support zones combined with Fibonacci retracement levels for higher-probability continuation setups.
8. Multi-Timeframe Analysis Tools
One of the biggest mistakes new Elliott Wave traders make is analyzing only one timeframe.
Professional traders combine:
- weekly trend direction
- daily structure
- intraday execution
This creates significantly more reliable setups.
Why Multi-Timeframe Analysis Matters
- Filters low-quality trades
- Aligns trend direction
- Improves entry timing
- Helps avoid counter-trend trades
Pro Tip
The highest-probability trades usually occur when lower timeframe setups align with higher timeframe Elliott Wave structure.
9. Stochastic Momentum Index (SMI)
The Stochastic Momentum Index is useful for measuring momentum exhaustion and identifying reversal timing during corrective phases.
Unlike traditional stochastic indicators, the SMI provides smoother momentum readings with reduced noise.
Why Traders Use It
- Detects momentum exhaustion
- Confirms corrective completions
- Improves reversal timing
- Works well in ranging conditions
Pro Tip
SMI signals become significantly stronger when they align with Fibonacci support zones and Elliott Wave corrective completion patterns.

10. Journaling Software
One of the most overlooked tools in Elliott Wave trading is journaling software.
Most traders focus only on entries and exits, but professional analysts track:
- wave count accuracy
- invalidation frequency
- setup quality
- emotional mistakes
- timing errors
Why Journaling Matters
Tracking Elliott Wave performance over time helps traders identify:
- recurring mistakes
- strongest setup types
- timeframe preferences
- market biases
Pro Tip
Many experienced Elliott Wave traders improve dramatically after reviewing invalidated wave counts and understanding why those counts failed.
Final Thoughts
Mastering Elliott Wave analysis in 2026 requires more than counting waves. The most successful traders combine Elliott Wave Theory with technical indicators, Fibonacci analysis, momentum tools, and multi-timeframe confirmation to improve decision-making and identify higher-probability trading opportunities.
Whether you’re analyzing Forex pairs, stock indices, commodities, or crypto markets, combining Elliott Wave structure with modern technical tools can significantly improve trade accuracy and risk management.
At Elliott Wave Forecast, our analysts combine proprietary blue boxes, Fibonacci extensions, momentum indicators, and sequence analysis to help traders identify market opportunities across multiple asset classes in real time.
If you want access to professional Elliott Wave analysis, live trading setups, and real-time chart updates, explore the Elliott Wave Forecast community and start with the $0.99 trial today.
FAQs
What is the best indicator for Elliott Wave Analysis?
Fibonacci extensions, RSI divergence, and the Elliott Wave Oscillator (EWO) are among the most commonly used tools for confirming wave counts and momentum.
Why is Fibonacci important in Elliott Wave Theory?
Fibonacci ratios help traders identify retracement zones, price targets, and potential wave completion areas.
How does RSI help Elliott Wave traders?
RSI divergence is often used to identify weakening momentum during Wave 5 and potential market reversals.
What are Blue Boxes in Elliott Wave Forecast?
Blue Boxes are proprietary reaction zones used to identify high-probability support and resistance areas during corrective structures.
Can Elliott Wave Theory be used in Forex and Crypto markets?
Yes. Elliott Wave Theory works across Forex, stocks, commodities, indices, and crypto markets.
Why is multi-timeframe analysis important?
It helps traders align lower timeframe setups with the larger market trend for higher-probability trades.
Is Elliott Wave suitable for beginners?
Yes, although mastering wave counting requires practice, market observation, and experience.
Where can traders access live Elliott Wave analysis?
Traders can access real-time forecasts, blue box setups, and market updates through the Elliott Wave Forecast community.


