Some traders that are new to Stock market might have heard the name AMAZON, but let’s start here Who is Amazon?
Amazon.com, Inc. is one of the world’s largest technology and e‑commerce companies. Founded by Jeff Bezos in 1994, it began as an online bookstore and has since expanded into a global powerhouse spanning retail, cloud computing (AWS), digital streaming, and artificial intelligence. Today, Amazon is not only a marketplace but also a logistics innovator, a leader in cloud infrastructure, and a key player in shaping consumer behaviour worldwide.
Below, I’ll outline how the EWF team anticipated Amazon’s bullish move before the rally that carried the stock back to all‑time highs.
The first chart below presents a classic Elliott Wave structure applied to Amazon’s daily price action. Elliott Wave theory suggests that markets move in predictable cycles of five waves in the direction of the trend, followed by three corrective waves.
Key takeaways from the forecast:
- The chart identified a corrective structure forming, with labelled waves (A), (B), and (C) ZigZag correction
- A blue target box highlighted a potential downside zone where wave (C) could complete.
- A “Turning Down” signal suggested short-term bearish pressure.
- However, the analysis clearly stated: “We do not recommend selling.”
This is important. The forecast wasn’t calling for a long-term bearish trend—it was identifying a pullback within a larger bullish structure.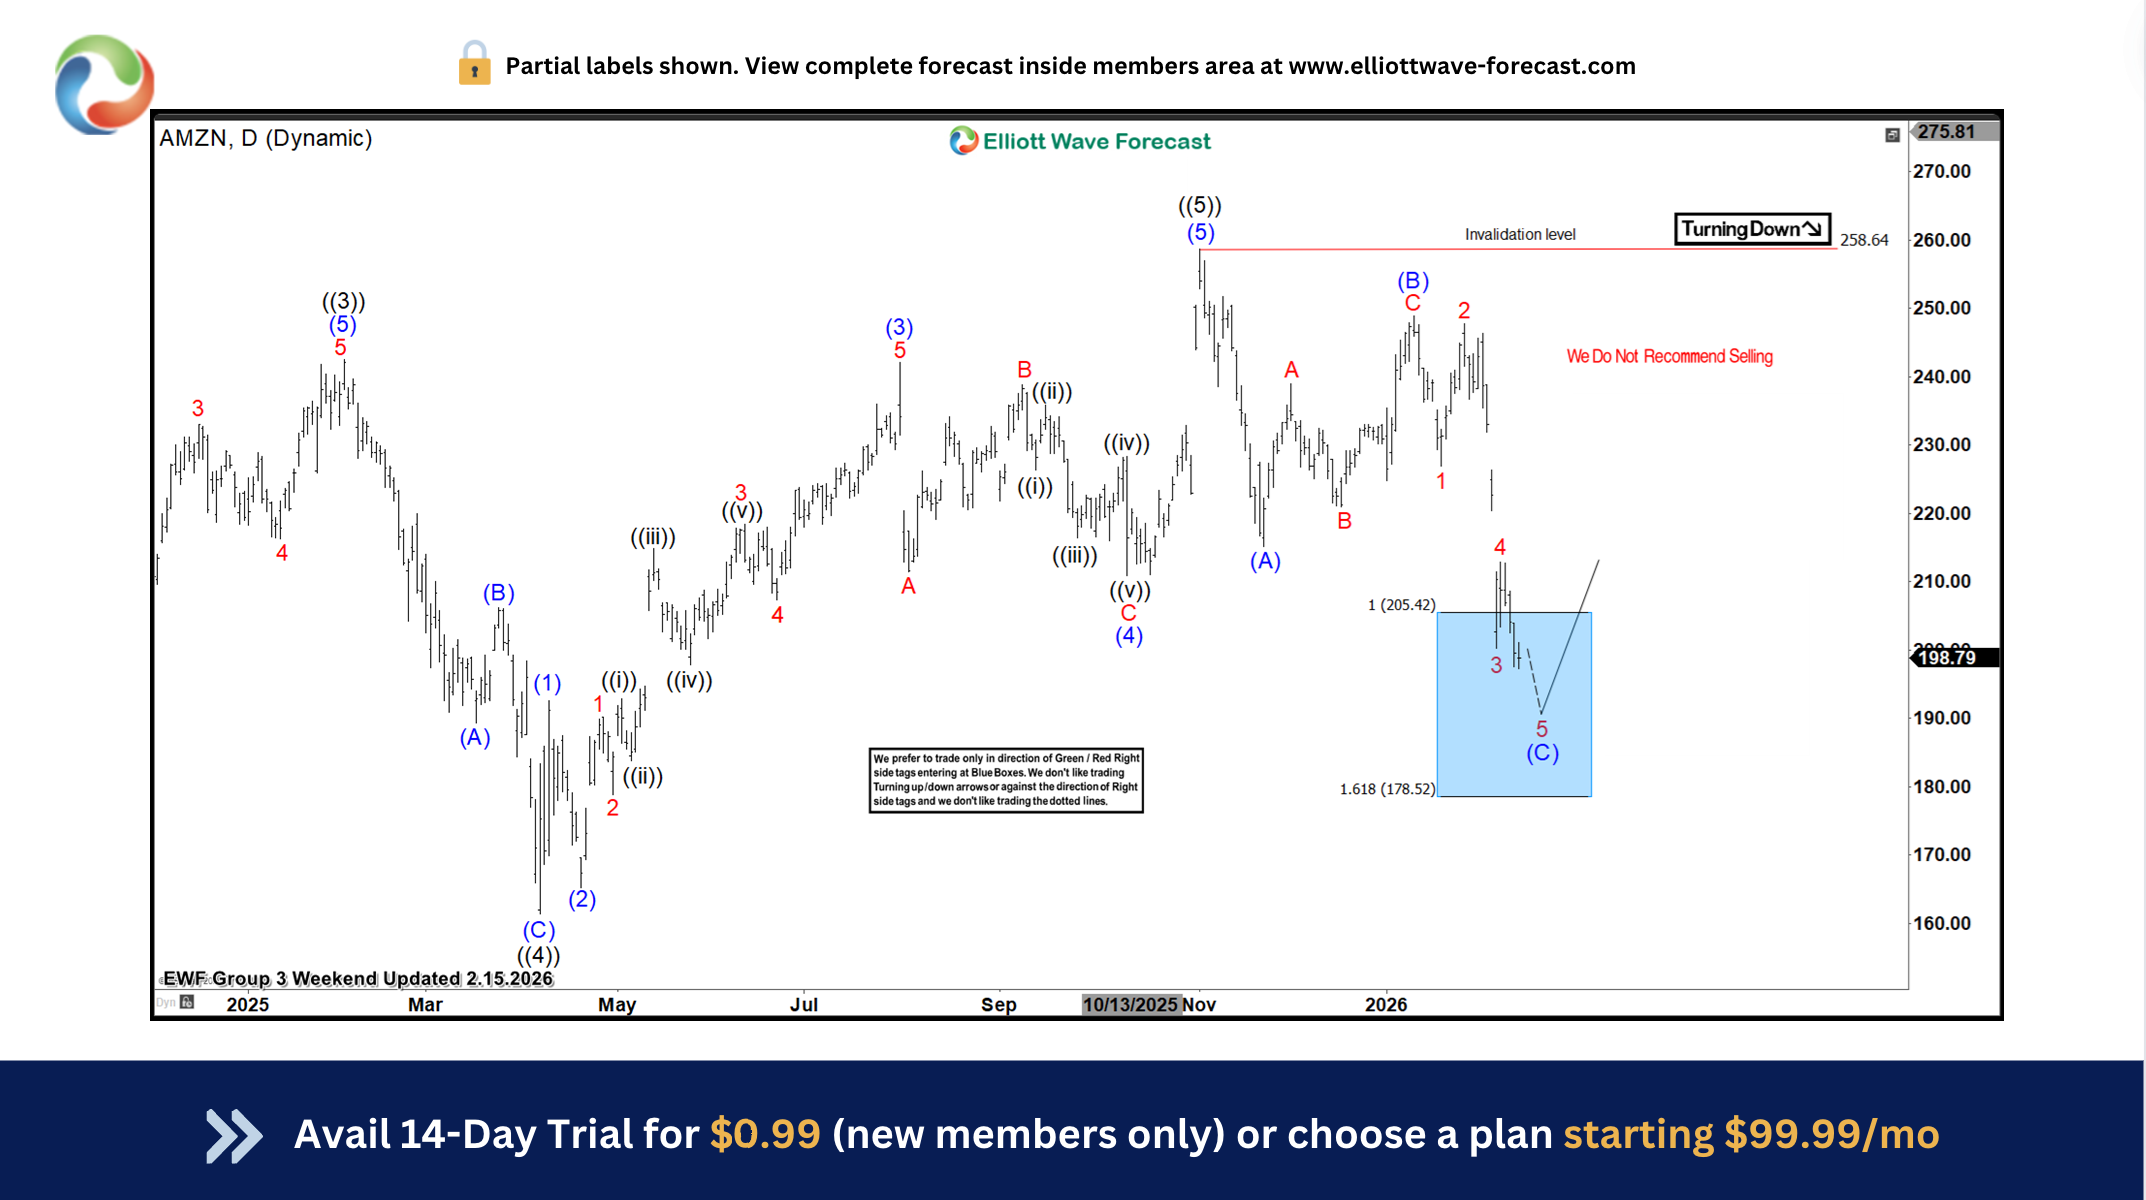
In the chart above, our focus was on the corrective structure unfolding at the time—specifically a Zigzag pattern labelled (A), (B), and (C).
What is a ZigZag and what does it mean to you as a Trader?
A Zigzag structure in Elliott Wave Theory is a sharp three‑wave corrective pattern labelled A‑B‑C, with a distinct 5‑3‑5 subdivision. It represents a counter‑trend move and is one of the most common corrective formations.
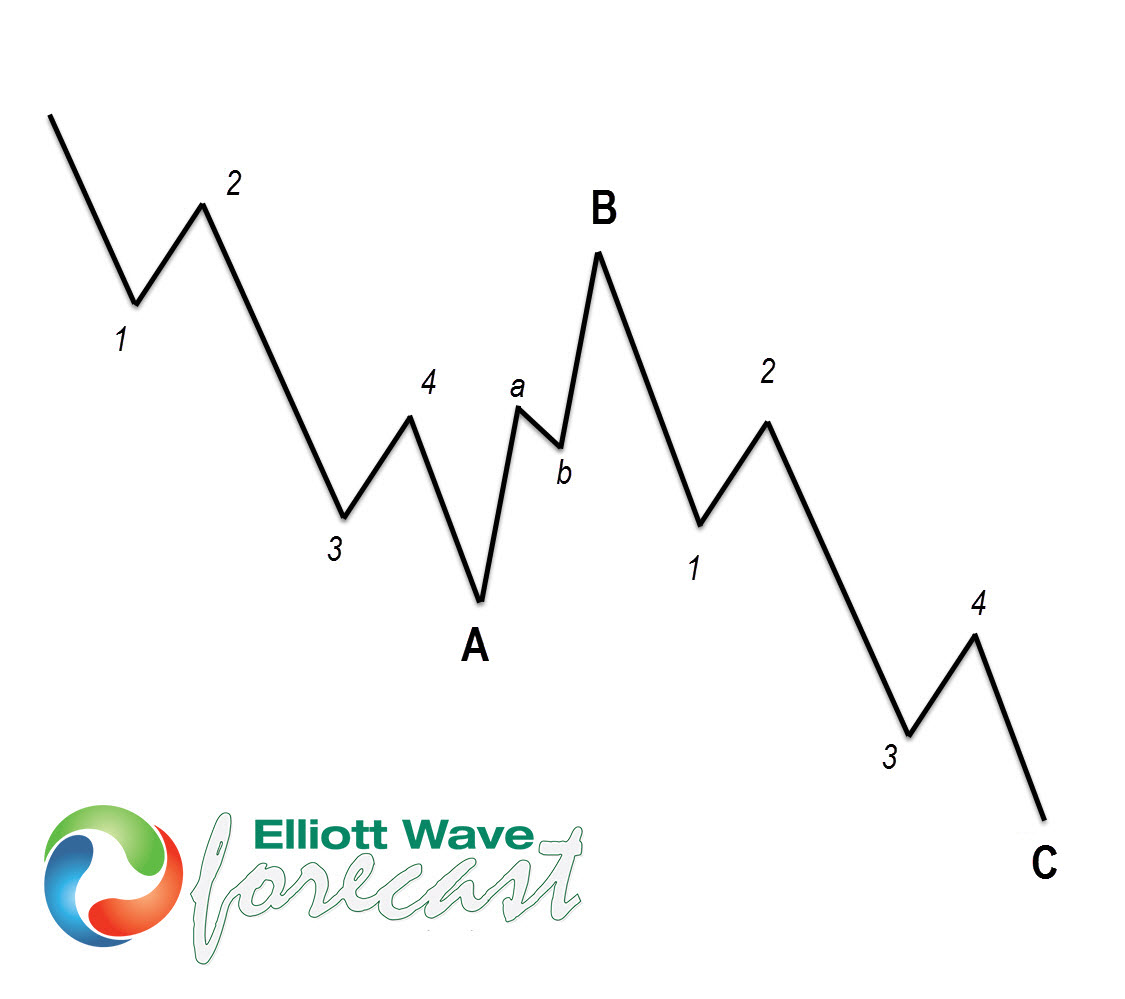
- Wave A → 5 sub‑waves (impulsive decline or rise depending on trend).
- Wave B → 3 sub‑waves (a smaller counter‑move).
- Wave C → 5 sub‑waves (another impulsive move, usually equal to or longer than Wave A).
Trading Insights
- Zigzags often signal continuation after correction, making them useful for identifying re‑entry points in the direction of the larger trend.
- Traders watch for Blue Box zones (high‑probability reversal areas) to align entries with the end of Wave C.
- Recognizing zigzags helps avoid mistaking them for trend reversals—they are corrective pauses, not new dominant trends.
Now that we understand what a Zigzag correction is, we can clearly connect that concept to the corrective structure shown in the chart above
The Outcome: What Actually Happened after the price reached the Blue box area.
The second chart shows how price action evolved after the forecast:
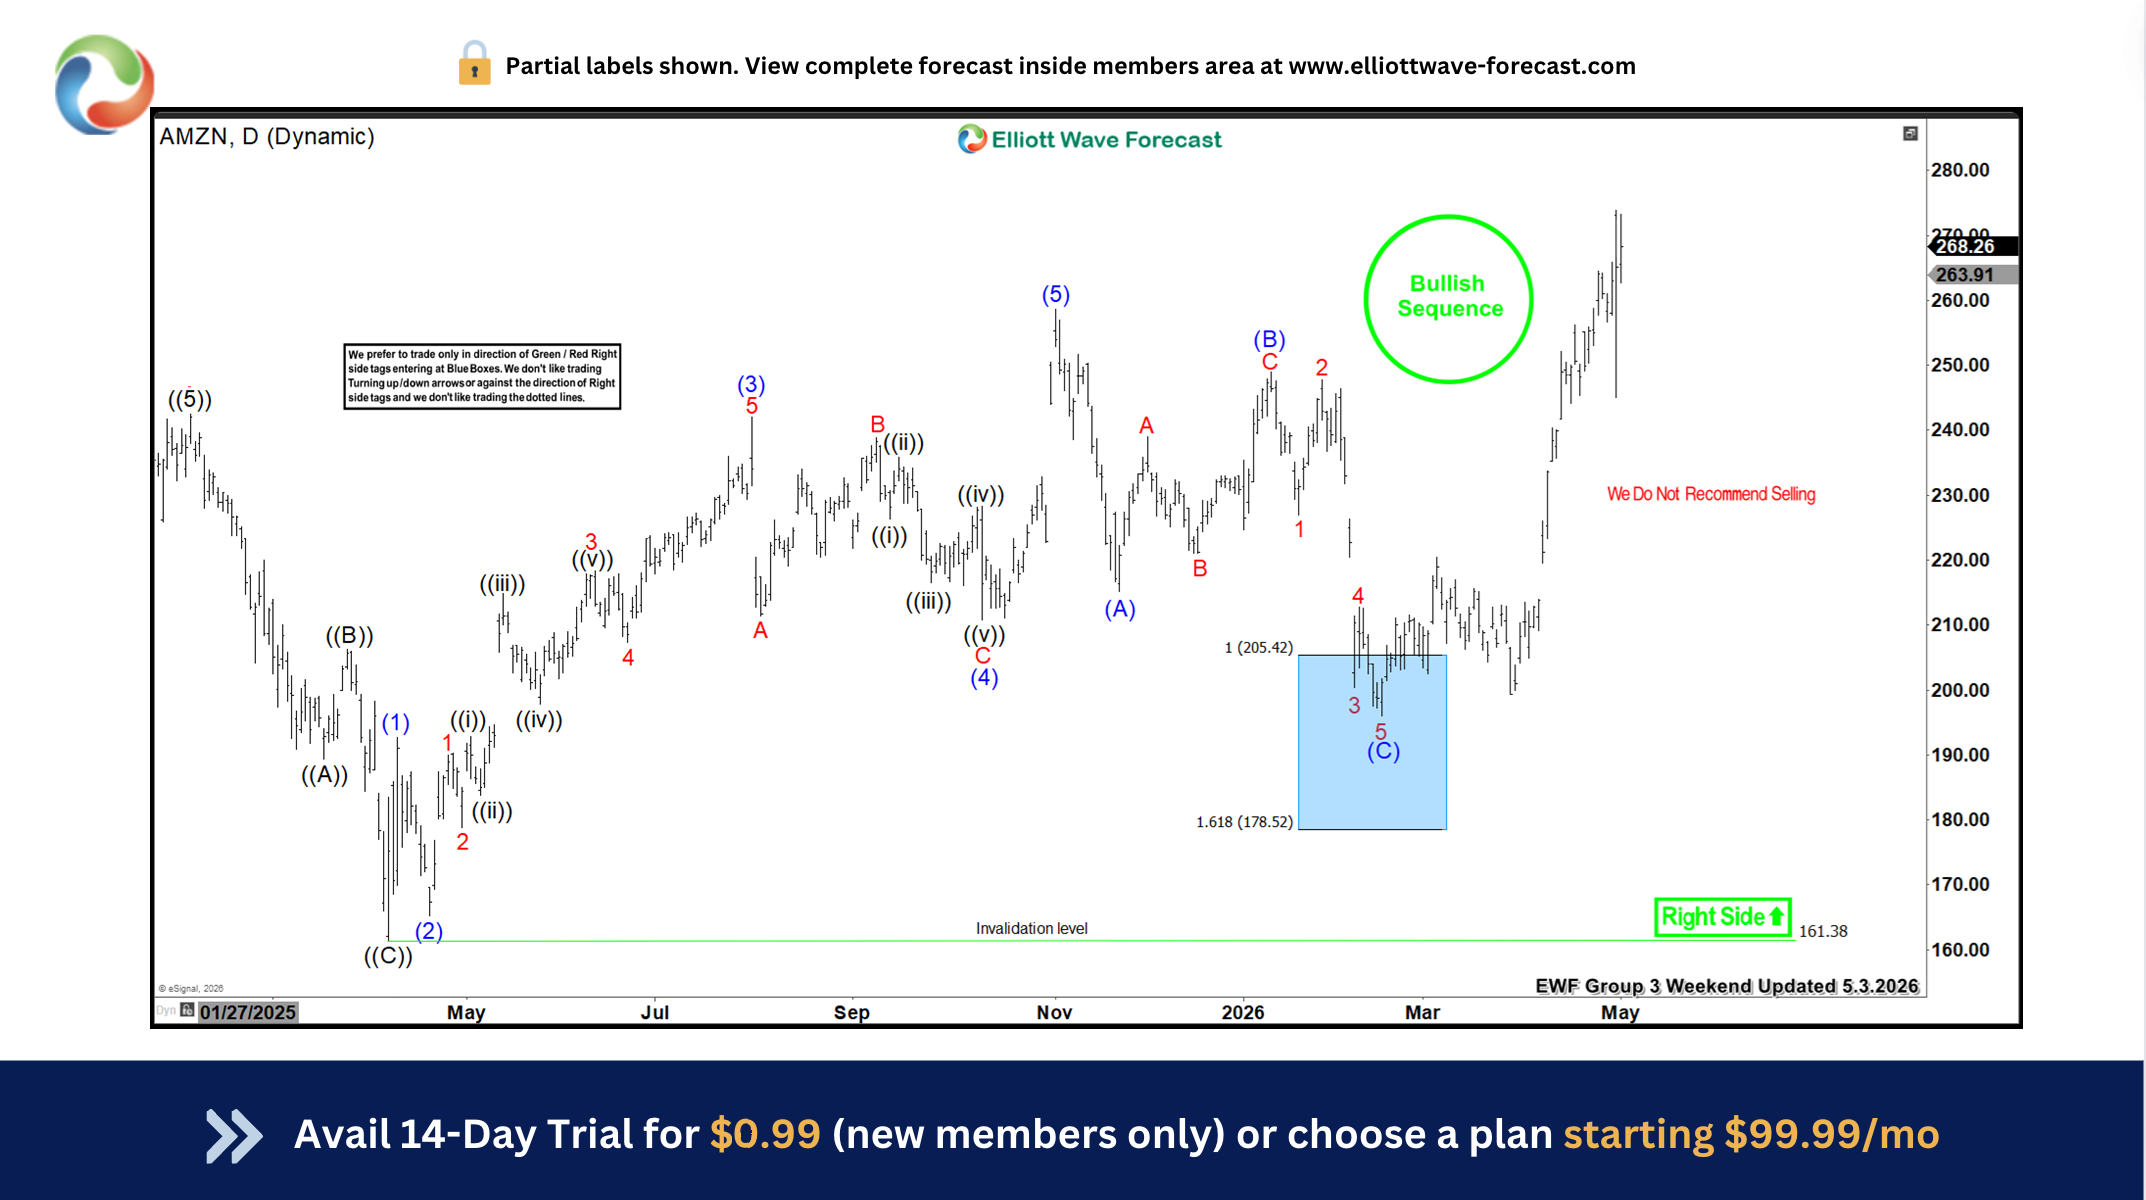
Amazon’s price dropped into the projected blue box, completing the expected corrective wave (C). The decline respected the Fibonacci extension zone at 1.618, which is a common target in Elliott Wave corrections. Once the correction finished, the stock reversed strongly upward and has since traded back to all‑time highs. This move established a clear “Bullish Sequence,” confirming the continuation of the broader uptrend.
Takeaway
Amazon’s charts showcase how Elliott Wave Forecast blends technical precision with practical trading guidance. The Blue Box strategy provided a clear, risk‑managed entry, and the subsequent rally validated the forecast. For traders, the lesson is simple: structure offers foresight, and foresight offers edge.
Conclusion
At Elliottwave Forecast (EWF), we deliver consistent market updates through regular charts update. Our analysts update 1‑hour charts four times daily and 4‑hour charts once per day across all 78 instruments. In addition, we host five live sessions each day and maintain a 24‑hour chatroom, providing clients with real‑time market guidance and answers to any questions they may have.
You can join us for a 14 day trial here


