Berkshire Hathaway (BRK.B) continues to trade within a strong bullish Elliott Wave structure, supported by a clear sequence of higher highs and higher lows. The long-term trend remains firmly to the upside, and the stock has developed a well-defined impulsive cycle over recent years.
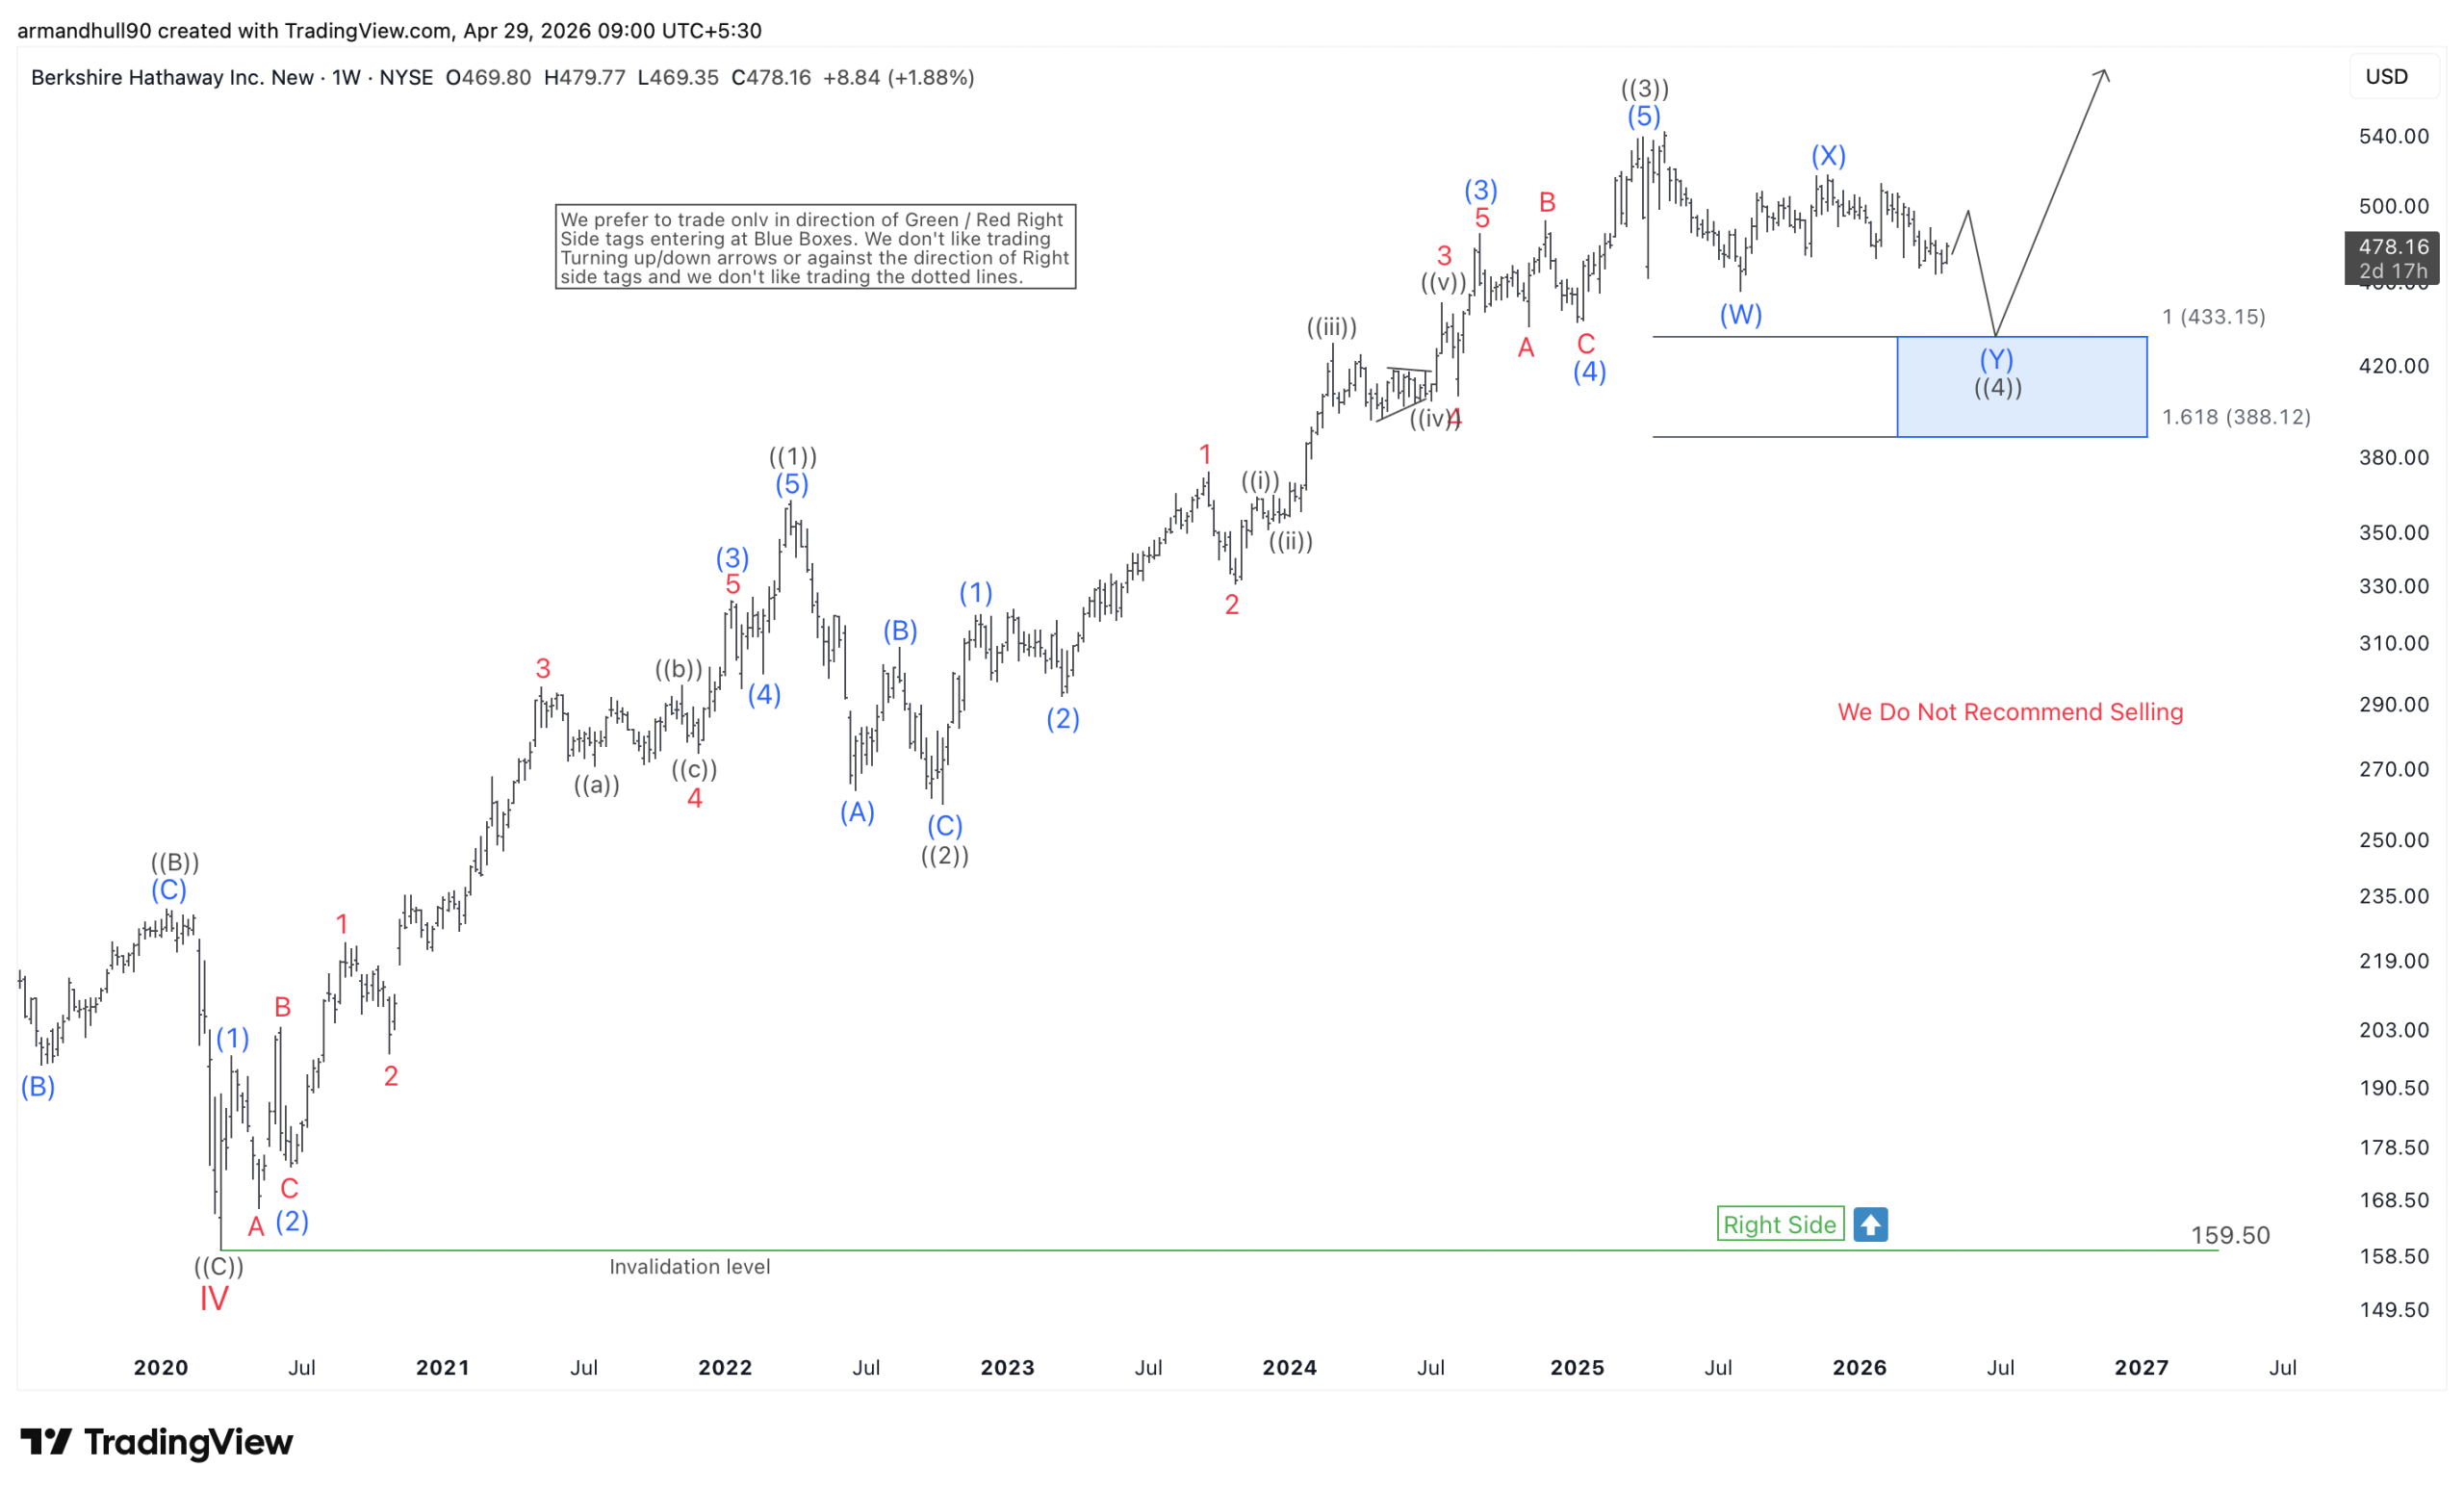
From the chart, BRK.B completed a strong advance into wave ((3)), which marked a significant high before entering a corrective phase. This impulsive move reflects sustained buying pressure and aligns with the broader bullish structure. After completing wave ((3)), the stock has transitioned into a corrective phase labeled as wave ((4)).
The current price action suggests that wave ((4)) is unfolding as a complex correction. The structure appears to be developing through a W-X-Y pattern, which typically signals a sideways to downward consolidation before the trend resumes. This type of correction often takes time and can include multiple swings before completion.
Wave ((4)) Pullback and Next Upside Potential
Wave ((4)) is expected to continue lower in the near term, with a projected support zone between 433 and 388. This area aligns with key Fibonacci retracement levels, including the 1.0 and 1.618 extensions of the prior corrective swings. The blue box region on the chart highlights this high-probability area where the correction may find support.
Once the stock completes wave ((4)), the next bullish leg higher in wave ((5)) should begin. This move would aim to break above the previous wave ((3)) high and continue the long-term uptrend. The overall structure supports further upside once the correction finishes.
In the short term, traders should avoid selling into the decline and instead prepare for potential buying opportunities at extreme levels. The best setups typically appear once the correction completes a clear 3, 7, or 11 swing structure within the highlighted support zone.
Summary
Berkshire Hathaway remains in a long-term bullish trend, despite the ongoing wave ((4)) correction. The stock may continue to pull back toward the 433–388 region before finding support. This zone should offer a buying opportunity for the next move higher in wave ((5)), which is expected to extend the bullish cycle further.


