Traders who apply Elliott Wave Theory rely on technical analysis to understand market behavior and make informed trading decisions. By combining wave patterns with key indicators, traders can identify trends, reversals, and optimal entry and exit points.
Using Fibonacci Retracement in Elliott Wave
The Fibonacci retracement tool is widely used to identify potential support and resistance levels. These levels help traders determine where corrective waves may end within an Elliott Wave structure.
For example, during an uptrend, after an impulsive wave completes, Fibonacci levels can highlight where the corrective wave is likely to retrace before the trend continues.
Average Directional Index (ADX) and Market Trends
The Average Directional Index (ADX) helps traders determine whether the market is trending or consolidating.
- High ADX → Strong trend
- Low ADX → Sideways market
Using ADX alongside Elliott Waves reduces the risk of trading in choppy, non-trending conditions.
Don’t trade the wave in isolation—use divergence as your ultimate confirmation tool to ensure you’re on the right side of the market trend.
MACD + Elliott Wave: A Powerful Combination
The MACD (Moving Average Convergence Divergence) indicator enhances Elliott Wave analysis by confirming momentum and trend direction.
Key MACD Signals:
- Signal Line Crossover
- Bullish: MACD crosses above signal line
- Bearish: MACD crosses below signal line
- Zero Line Crossover
- Above zero → Positive momentum
- Below zero → Negative momentum
- Divergence
- Bullish: Price makes lower low, MACD makes higher low
- Bearish: Price makes higher high, MACD makes lower high
A bullish crossover during Wave 3, for instance, strengthens confidence in a strong trend continuation.
RSI for Confirming Wave Strength
The Relative Strength Index (RSI) measures whether a market is overbought or oversold.
- RSI > 70 → Overbought (possible reversal)
- RSI < 30 → Oversold (possible bounce)
In Elliott Wave analysis:
- Overbought RSI during Wave 5 may signal trend exhaustion
- RSI divergence often appears near major turning points
Using Correlation in Elliott Wave Analysis
Sometimes, a market lacks a clear wave structure. Traders can analyze correlated assets to gain clarity.
For example, instruments like Ten-Year Yields (TNX) and USD/JPY often move together. By analyzing the clearer chart, traders can apply that structure to the correlated asset.
Stochastic Oscillator for Timing Reversals
The Stochastic Oscillator compares closing prices to a price range over time and helps identify:
- Overbought conditions
- Oversold conditions
- Potential reversal points
When aligned with Elliott Wave patterns, it improves timing accuracy for entries and exits.
Moving Averages and Wave Confirmation
Moving averages smooth price action and reveal the overall trend.
A common strategy:
- Short-term MA crossing above long-term MA → Bullish signal
- Short-term MA crossing below long-term MA → Bearish signal
This helps confirm the transition between corrective and impulsive waves.

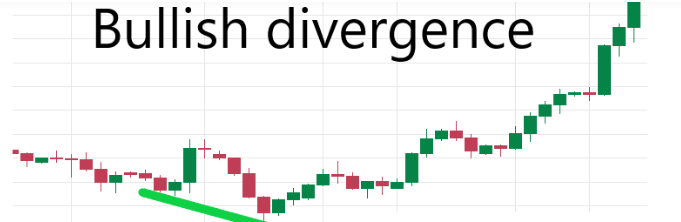
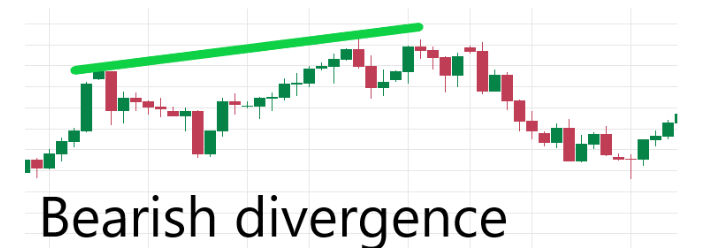
Understanding Divergence in Trading
Divergence occurs when price moves in one direction while an accurate indicator moves in the opposite direction.
Types of Divergence
1. Regular Divergence (Trend Reversal)
- Bearish: Price ↑ (higher highs), indicator ↓
- Bullish: Price ↓ (lower lows), indicator ↑
2. Hidden Divergence (Trend Continuation)
- Bullish: Price ↑ (higher low), indicator ↓
- Bearish: Price ↓ (lower high), indicator ↑
Real-World Example (EUR/JPY)
A bearish divergence appeared when price made higher highs, but MACD did not confirm. This led to a strong downtrend.
Later, a hidden bearish divergence confirmed trend continuation, resulting in a move of over +710 pips.
RSI Divergence in Elliott Wave
RSI divergence often appears in:
- Wave 5 (trend exhaustion)
- Wave B (complex corrections)
This signals a weakening trend and potential reversal.
Conclusion
Elliott Wave Theory provides a structured way to analyze market psychology and price movement. When combined with indicators like:
- MACD
- RSI
- Fibonacci
- ADX
- Stochastic
…it becomes a powerful system for identifying trends, reversals, and high-probability trade setups.
By integrating divergence analysis and technical indicators, traders can gain deeper market insight and improve decision-making accuracy.
FAQs
1. What is Elliott Wave Theory?
A method that uses wave patterns to predict market trends.
2. What is divergence in trading?
When price and indicators move in opposite directions, signaling a possible reversal.
3. Which indicators work best with Elliott Wave?
MACD, RSI, Fibonacci, ADX, and Stochastic.
4. What is regular vs hidden divergence?
Regular = reversal, Hidden = continuation.
5. How does MACD help in Elliott Wave?
It confirms trends using crossovers and divergence.
6. Can RSI predict reversals?
Yes, especially with overbought/oversold levels and divergence.
7. Why use Fibonacci in trading?
To find support, resistance, and wave retracement levels.
8. What does ADX do?
It measures trend strength.
9. Is Elliott Wave accurate?
It’s not perfect but improves accuracy with indicators.
10. Which timeframe is best?
All timeframes work; combine multiple for better analysis.


