Industrial Select Sector SPDR Fund (XLI) ended the March 2026 pullback at the point where Elliott Wave Forecast Blue Box recommended members to go long. What’s next following this rebound?
The US Industrial sector has been one of the most profitable since the turn of the millennium. The XLI ETF established a long bullish cycle from the March 2009 low. Since then, it has remained bullish, continuing to establish a higher high – lower low sequence.
Our weekly chart shows the end of the cycle degree wave IV of the supercycle wave (I) at the low of March 2020. From that low, the ETF moved upwards for about two years, establishing a top in November 2021, where we placed wave (I). From that peak, the price corrected lower to finish wave (II) in October 2022.
Meanwhile, from the October 2022 low, the supercycle degree wave (III) commenced. Wave I of (III) concluded at the November 2024 high. A subsequent sharp pullback extended until April 2025, where we identified the conclusion of wave II of (III). The resurgence from April 2025 continued throughout 2025 and into 2026, mirroring trends seen in most stocks, indices, and ETFs. XLI peaked in March 2026, establishing ((1)) of III of (III). Consequently, since the March 2020 low, XLI has completed a distinct 5-swing sequence, which should extend to at least 9 swings. At the break of the previous peak, we recommended members to buy the dips within the blue box. Our most recent trade setup was shared on March 18th.
XLI Elliott Wave Trade Setup – 18th March, 2026 Update
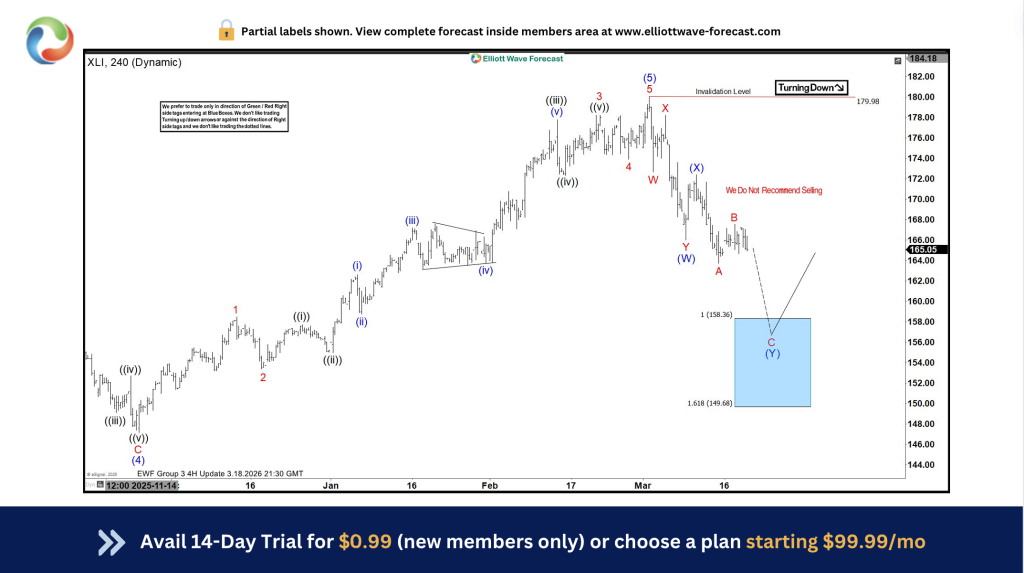
On March 18, 2026, we shared the chart above with members. The chart illustrates the nature of the pullback for wave ((2)) of I from the March 2026 peak. The structure was developing as an incomplete double zigzag, a 7-swing price pattern, which is one of our “bread and butter” setups. Therefore, we shared the chart, highlighting the blue box at 158.36-149.69. From this blue box, we recommended members to go long on the ETF.
XLI Elliott Wave Trade Setup – 16th April, 2026 Update
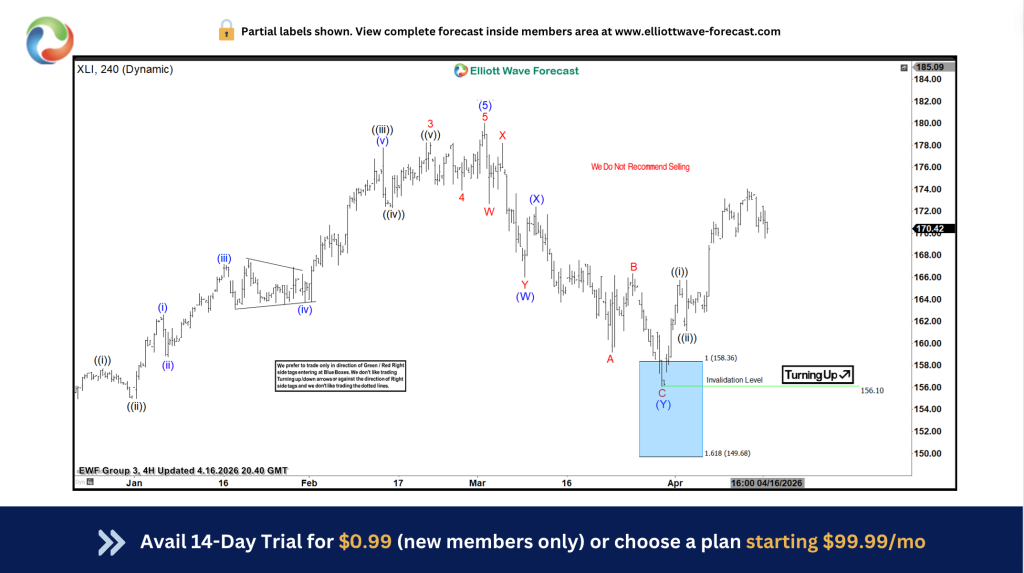
Barely a month later, we shared the chart above with members. The H4 chart shows the price completed the double zigzag structure as expected. In addition, the structure finished in the blue box buying zone. A big resurgence quickly followed as soon as the price triggered the blue box. The resurgence lasted throughout the last week and is poised to continue in the coming weeks. With this, members booked partial profit from the blue box and are now holding the rest of the trade at breakeven. This is how we provide members daily with blue boxes for 78 instruments across all timeframes. Our 14-day trial for just $0.99 is your best bet to see what we do on the inside.
About Elliott Wave Forecast
At www.elliottwave-forecast.com, we update one-hour charts four times daily and four-hour charts once daily for all 78 instruments. We also conduct daily live sessions to guide clients on the right side of the market. Additionally, we have a chat room where moderators answer market-related questions. Experience our service with a 14-day trial for only $o.99. Cancel anytime by contacting us at support@elliottwave-forecast.com.


