Tesla (TSLA) has followed the broader pattern seen across major global indices and completed a corrective cycle from the April 2025 low. This decline has been identified as wave II, which ended at $337.2. The stock has since turned higher. However, it must still break above the previous all‑time high at $498.8, set earlier this year, to fully invalidate the possibility of a double correction. That scenario appears less probable because major benchmarks such as the S&P 500 (ES) and Nasdaq 100 (NQ) have already pushed to new all‑time highs above their respective peaks from earlier in the year.
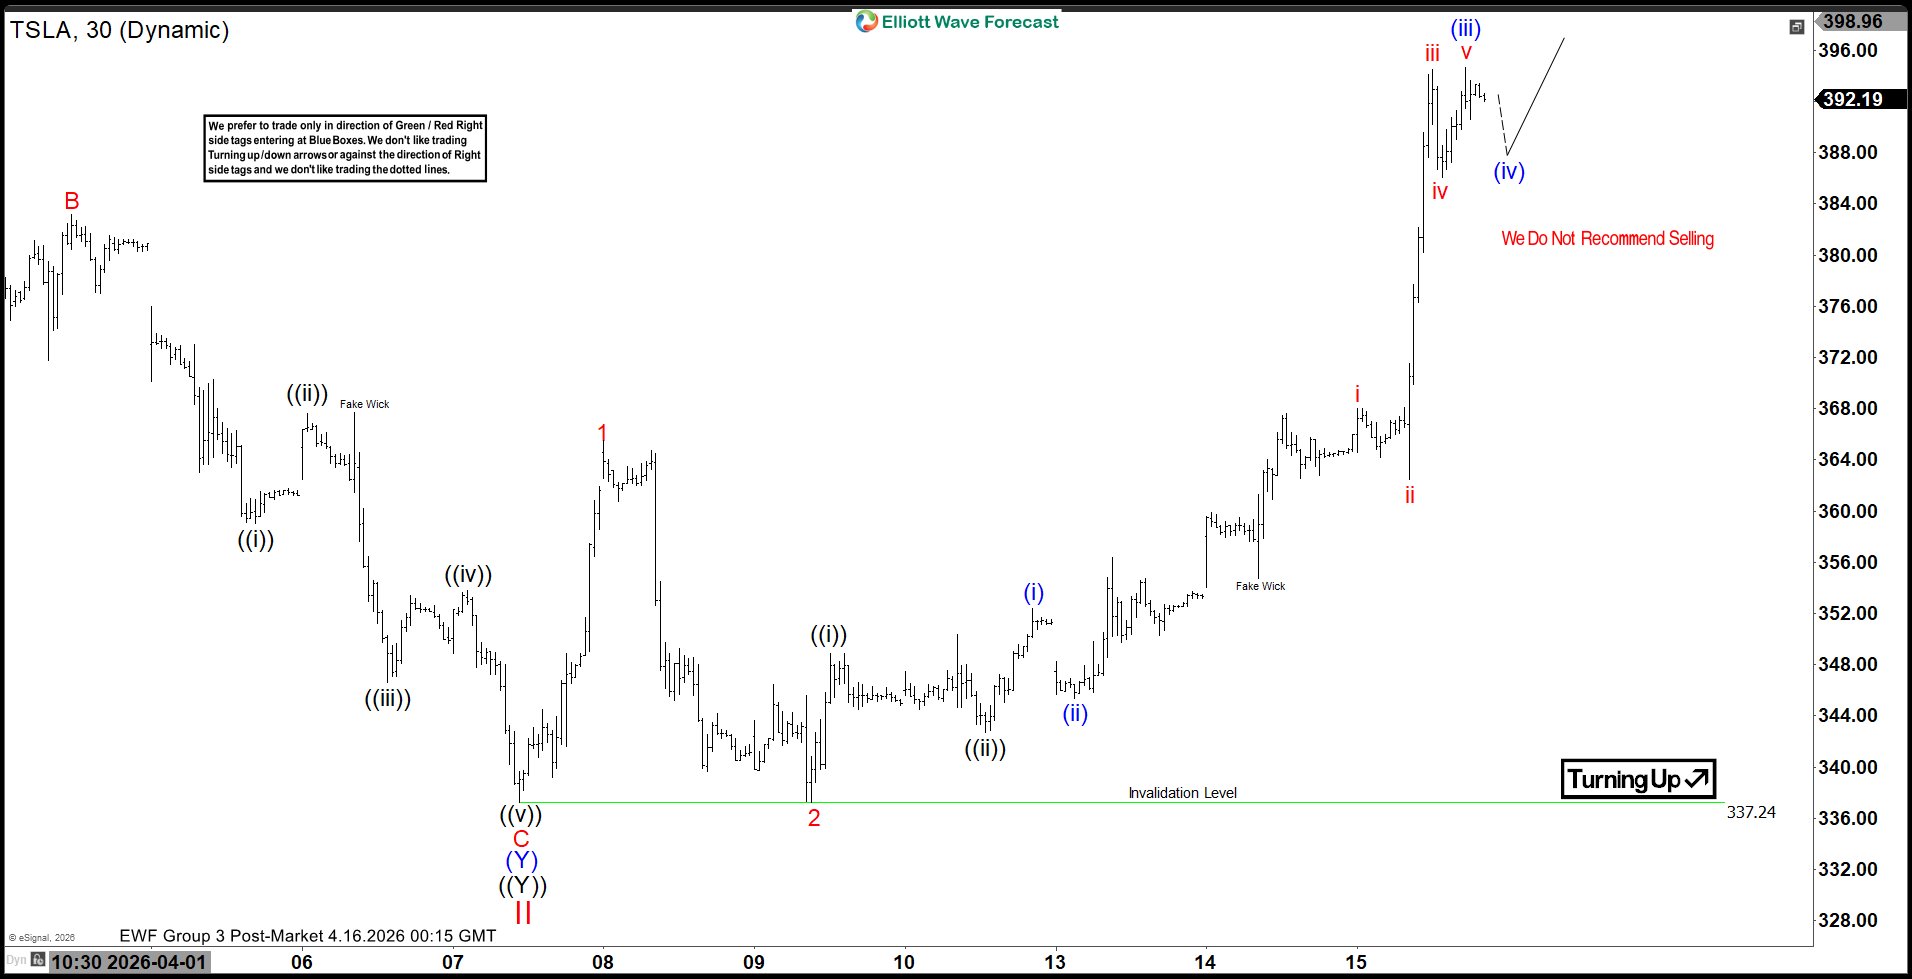
From the wave II low, Tesla has begun to advance in a five‑wave impulsive Elliott Wave structure. The rally to $365.49 completed wave 1, and the subsequent pullback to $337.25 completed wave 2. The stock has resumed higher in wave 3, which is developing as another impulsive structure of a lesser degree. From the wave 2 low, wave ((i)) ended at $348.88, and the pullback in wave ((ii)) ended at $342.74. The price action suggests that short‑term dips should continue to attract buyers as the stock works through additional highs to complete the five‑wave sequence from the wave II low.
In the near term, the bullish outlook remains valid as long as the pivot at $337.2 stays intact. Any pullback should find support in a three‑, seven‑, or eleven‑swing corrective sequence before the broader advance resumes.