
Market trends rarely move in a straight line. Even during strong bullish or bearish markets, prices periodically retrace before continuing in the direction of the main trend. In Elliott Wave Theory, these retracements are called corrective waves. Corrective waves are an important component of Elliott Wave Theory, which explains how markets move in repeating wave patterns.
Understanding Elliott Wave corrective waves allows traders to identify market pullbacks, anticipate potential reversal zones, and determine where the next impulse wave may begin.
What Are Corrective Waves?
Elliott Wave corrective waves are price movements that retrace the primary trend and typically unfold in three-wave structures. These corrections often appear as zigzags, flats, triangles, or more complex combinations.
In a bullish trend:
- Five waves move upward (impulse waves)
- Three waves move downward (corrective waves)
In a bearish trend, the structure reverses.
Corrective waves are often more complex than impulse waves because they may combine multiple patterns and evolve as the market develops. Many corrective wave structures resemble common chart patterns used in technical analysis.
Types of Elliott Wave Corrective Patterns
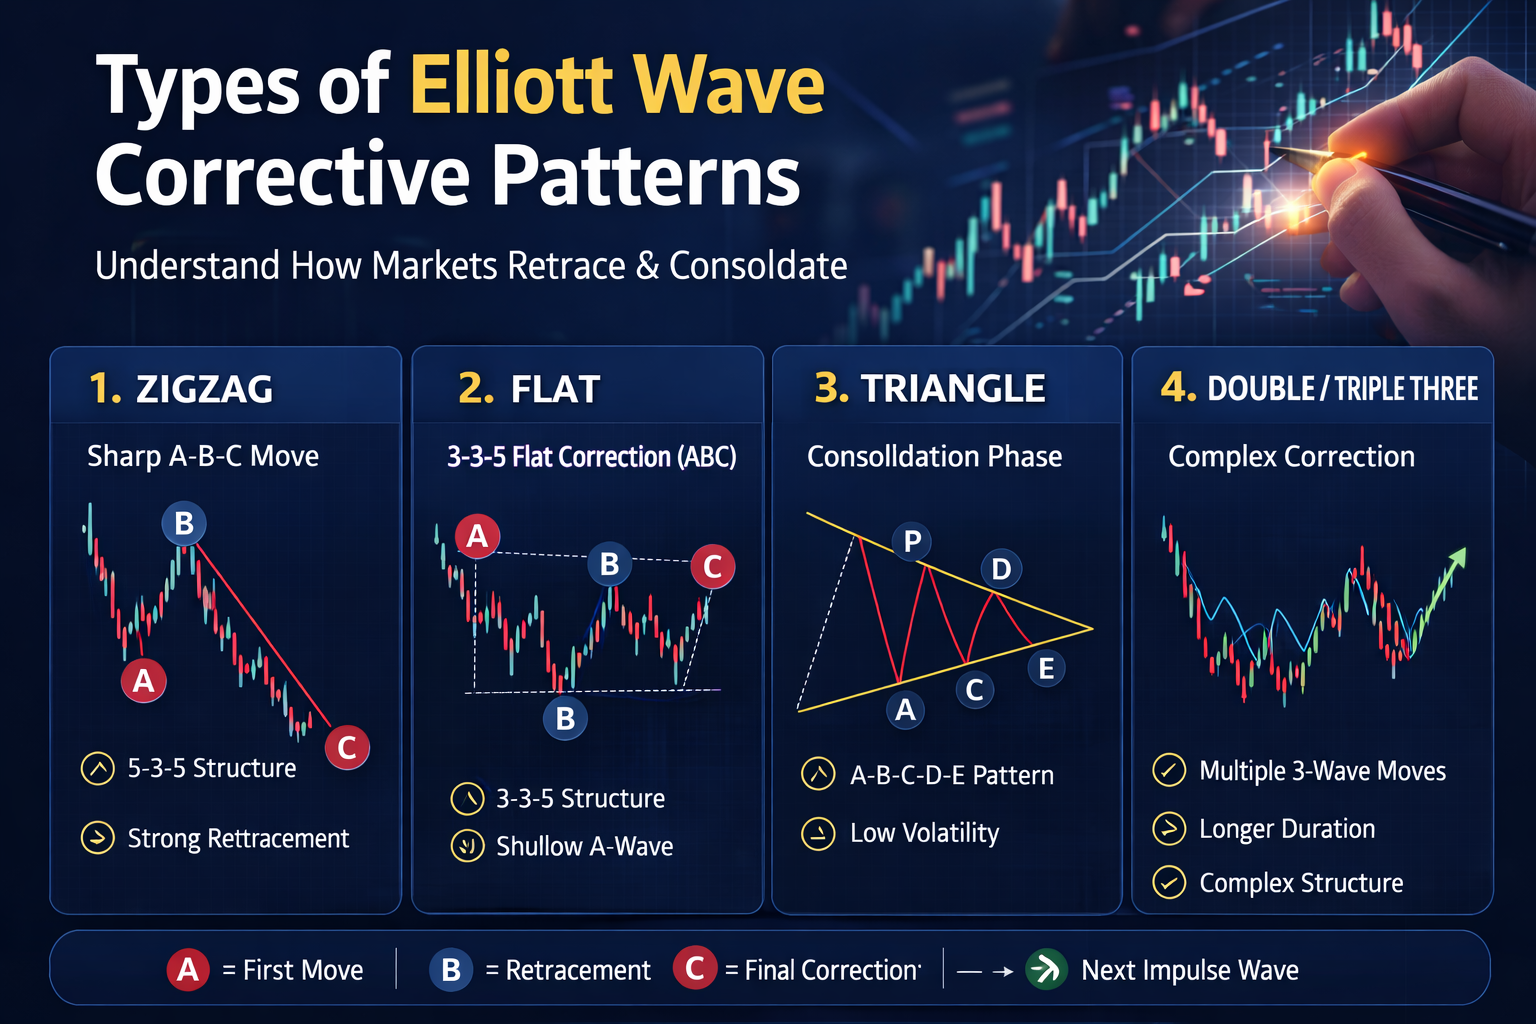 Corrective waves typically fall into four main categories:
- Zigzags
- Flats
- Triangles
- Double and Triple Threes
Each pattern represents a different form of market correction.
1. Zigzag Corrections
A zigzag correction is a sharp counter-trend move that typically retraces a large portion of the previous impulse wave.
Structure:
Wave A – 5 waves
Wave B – 3 waves
Wave C – 5 waves
This creates a 5-3-5 structure.
Basic Rules of Zigzag Patterns
- Corrective structure labeled ABC
- Wave A subdivides into five waves
- Wave B subdivides into three waves
- Wave C subdivides into five waves
- Overall structure follows 5-3-5
Sometimes zigzags appear multiple times in succession.
When this happens, they form:
Double Zigzag – WXY
Triple Zigzag – WXYXZ
These patterns extend the correction when a single zigzag is not sufficient.
2. Flat Corrections
A flat correction develops when markets move sideways rather than sharply against the trend.
Structure:
Wave A – 3 waves
Wave B – 3 waves
Wave C – 5 waves
This forms a 3-3-5 structure.
Regular Flat
In a regular flat:
- Wave B ends near the start of Wave A
- Wave C moves slightly beyond Wave A
Key Guidelines:
- Corrective ABC pattern
- Wave A and B subdivide into three waves
- Wave C subdivides into five waves
- Wave C often ends with momentum divergence
Expanded Flat
Expanded flats are more common than regular flats.
Characteristics:
- Wave B moves beyond the start of Wave A
- Wave C extends significantly beyond Wave A
This pattern frequently appears during strong trends.
Running Flat
A running flat occurs when the trend is extremely strong.
Characteristics:
- Wave B extends far beyond Wave A
- Wave C fails to move below Wave A
Running flats are rare but indicate powerful market momentum.
3. Triangle Corrections
Triangles represent periods of consolidation where buying and selling pressure reach equilibrium.
Structure:
A-B-C-D-E
Sub-wave structure:
3-3-3-3-3
Triangles usually appear during:
- Wave 4 corrections
- Wave B corrections
Types of Elliott Wave Triangles
There are four triangle variations:
- Ascending triangle
- Descending triangle
- Contracting triangle
- Expanding triangle
Triangles often signal that the market is preparing for one final move in the direction of the larger trend. Many corrective wave structures share similarities with common trading patterns explained in technical analysis, helping traders better interpret market consolidations and reversals.
4. Double Threes and Triple Threes
Complex sideways corrections often combine multiple patterns together.
These combinations are called double threes or triple threes.
Double Three (WXY)
Structure:
Wave W – first corrective pattern
Wave X – connector wave
Wave Y – second corrective pattern
Double threes contain seven price swings.
Triple Three (WXYXZ)
Triple threes combine three corrective structures.
Structure:
Wave W
Wave X
Wave Y
Wave X
Wave Z
These patterns create an eleven-swing structure and usually appear during extended sideways markets. Traders often confirm corrective wave structures using momentum indicators such as the RSI trading strategies, which help identify potential reversal zones and market exhaustion.
How to Identify Corrective Waves in Trading
Traders typically identify corrective waves using several tools:
• Elliott Wave structure
• Fibonacci retracement levels
• momentum divergence
• RSI confirmation
Corrective waves often retrace between 38.2% and 61.8% of the previous impulse wave.
Combining Elliott Wave analysis with Fibonacci retracement helps traders identify potential reversal zones.
Forecasting Corrective Waves
One advantage of Elliott Wave analysis is that it provides guidelines for estimating where corrections may end.
A common guideline states that corrections often retrace into the price range of the previous fourth wave of a smaller degree.
This area frequently acts as a high-probability support or resistance zone where the next impulse wave may begin.
Follow Professional Elliott Wave Analysis
If you want to see how professional analysts apply Elliott Wave corrective patterns in real markets, explore our latest market forecasts across forex, indices, crypto, and commodities.

Many traders combine Elliott Wave corrections with technical tools such as the best forex indicators to better identify momentum shifts and potential trend reversals.
Real Market Example of Corrective Waves
Corrective waves frequently appear in major financial markets when prices pause or retrace before continuing in the direction of the dominant trend. Identifying these corrections helps traders anticipate potential support and resistance zones where the next impulse wave may begin.
For example, corrective structures such as zigzags, flats, and triangles often develop during pullbacks in major currency pairs like EURUSD. Traders monitor these corrective formations to determine whether the market is preparing for another bullish or bearish impulse.
Similarly, commodities such as gold regularly experience corrective phases after strong directional moves. A zigzag or flat correction may form as the market consolidates before continuing the broader trend.
Equity indices can also display complex corrective patterns. Markets like the S&P 500 or Nasdaq often move sideways during triangle or combination corrections before resuming the prevailing trend.
To see how Elliott Wave corrective patterns unfold in real markets, explore our latest forecasts:
• Nasdaq Forecast
These examples demonstrate how Elliott Wave analysis can help traders identify corrective phases and anticipate potential market turning points.
Frequently Asked Questions
What are Elliott Wave corrective waves?
Corrective waves are market retracements that move against the primary trend and typically unfold in three-wave structures.
How many waves are in a corrective pattern?
Most corrective patterns follow an ABC structure.
Are corrective waves harder to identify than impulse waves?
Yes. Corrective waves are often more complex and may combine multiple patterns.
What happens after a corrective wave finishes?
After a correction ends, the market usually resumes the main trend with the next impulse wave.


