 Financial markets move in recognizable structures — not random chaos. One of the most powerful ways traders identify these structures is through chart patterns.
What Are Chart Patterns?
Chart patterns are structured formations created by price movements on a financial chart. These patterns represent recurring behaviors in the market and help traders anticipate potential future price movements. Many professional traders combine chart patterns with elliott wave theory to better understand market cycles and improve the accuracy of trend continuation and reversal setups.
Chart patterns are formed by connecting significant price points such as highs, lows, and closing prices using trend lines. These lines can be straight or curved and typically define areas of support and resistance.
Every chart pattern provides:
-
Potential entry points
-
Logical exit points
-
Defined risk levels
-
A directional bias (bullish, bearish, or neutral)
Chart patterns can develop on any timeframe — hourly, daily, weekly, or monthly — making them useful for day traders, swing traders, and long-term investors alike.
In technical analysis, recognizing chart patterns is essential because markets tend to move in repeating cycles driven by crowd psychology.
To understand the broader foundation of technical formations in the market, you can read our detailed guide on trading patterns explained, where we break down how price structures develop across different timeframes.
Why Chart Patterns Matter in Trading
Identifying chart patterns is one of the most important skills in technical analysis. Here’s why:
1. Informed Decision-Making
Chart patterns remove emotional bias from trading decisions. Instead of reacting to news or fear, traders rely on structured price formations.
When traders recognize bullish chart patterns or bearish chart patterns, they gain insight into:
-
Market sentiment
-
Potential trend reversals
-
Continuation setups
-
Risk-to-reward opportunities
For example:
-
If price forms higher highs and higher lows within a pattern, it signals bullish strength.
-
If price forms lower highs and lower lows, it indicates bearish pressure.
This structured approach leads to disciplined execution.
2. Increased Profitability
One of the most powerful aspects of chart patterns is that they repeat over time.
Because markets are driven by human behavior, similar price structures appear again and again. Traders who master chart pattern recognition can:
-
Identify high-probability trade setups
-
Anticipate breakouts
-
Position early in trend continuations
-
Spot reversal zones before major moves
Classic chart patterns, candlestick formations, and continuation patterns all provide tradable opportunities when combined with proper confirmation.
Traders who want to deepen their understanding of price action and chart structures can explore our curated list of Best Technical Analysis Books to Read in 2026, featuring essential resources for mastering chart patterns and market analysis.
3. Directional Bias
Recognizing chart patterns helps traders establish a clear market bias:
-
Bullish bias
-
Bearish bias
-
Neutral/sideways bias
This allows traders to align with the dominant trend instead of fighting it — a key principle in professional trading.
4. Clear Entry and Exit Points
Well-defined chart patterns provide structured trade planning:
-
Entry near breakout zones
-
Stop-loss placement below/above structure
-
Profit targets based on measured moves
This improves consistency and reduces random decision-making.
5. Improved Risk Management
Risk management is critical in trading. Chart patterns help define:
-
Invalidations
-
Stop placement levels
-
Breakout confirmation zones
When structure is clear, risk can be controlled effectively.
If you’d like to see how chart patterns are applied in real-time market analysis, you can begin a 14-Day Trial and explore our professional forecasts across Forex, stocks, commodities, and crypto markets.
Most Common Chart Patterns Every Trader Should Know
Below are some of the most widely used chart patterns in technical analysis.
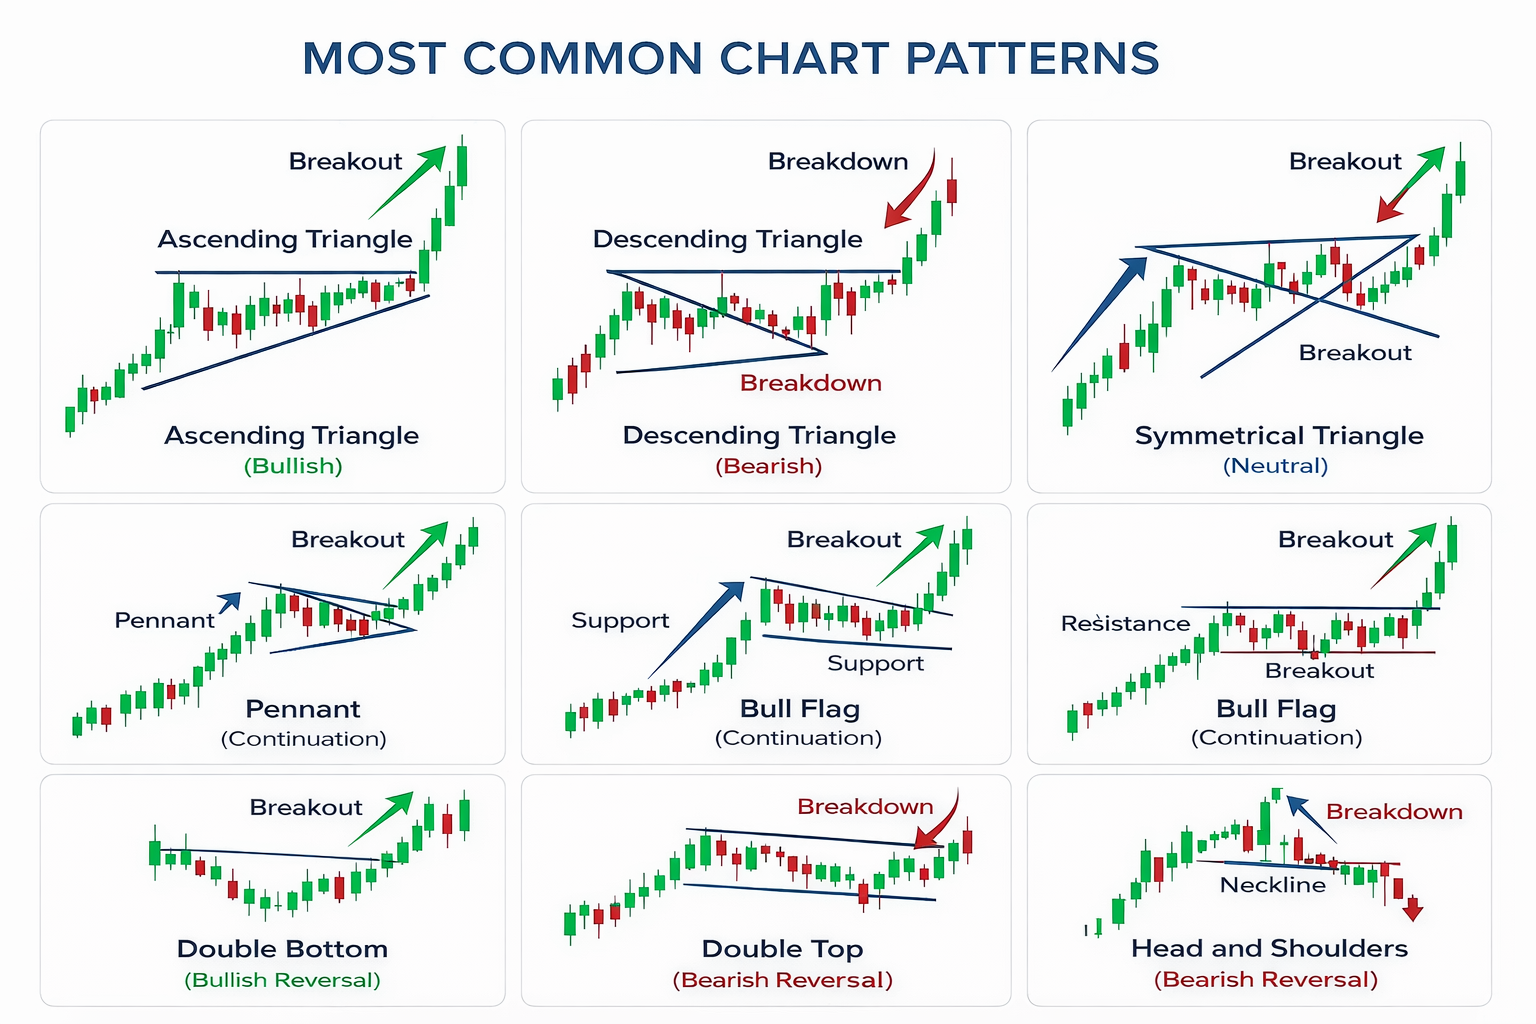
Ascending Triangle (Bullish Continuation Pattern)
-
Flat resistance level
-
Rising support trendline
-
Breakout typically occurs upward
This pattern reflects increasing buying pressure.
Descending Triangle (Bearish Continuation Pattern)
The descending triangle is a bearish chart pattern.
Characteristics:
-
Flat support level
-
Falling resistance line
-
Downward breakout is likely
It signals increasing selling pressure.
Symmetrical Triangle (Neutral Breakout Pattern)
The symmetrical triangle forms when both support and resistance converge.
-
No directional bias initially
-
Breakout can occur in either direction
-
Often precedes strong volatility
Pennant Pattern
Pennants form after strong price moves followed by brief consolidation.
-
Small symmetrical structure
-
Continuation pattern
-
Breakout typically follows prior trend
While chart patterns help identify trade setups, our On-Demand Elliott Wave Analysis delivers professional market forecasts using Elliott Wave structure and advanced technical tools.
Flag Pattern
The flag pattern appears as a small rectangle sloping against the main trend.
-
Parallel support and resistance
-
Breakout usually continues prior trend
Flags are strong continuation signals.
Double Bottom (Bullish Reversal Pattern)
The double bottom resembles the letter “W”.
- Two failed attempts to break support
-
Break above resistance confirms reversal
-
Signals shift from bearish to bullish trend
Double Top (Bearish Reversal Pattern)
Head and Shoulders Pattern
-
Three peaks (middle peak highest)
-
Neckline support
-
Breakdown confirms bearish reversal
The inverse variation signals bullish reversal.
Traders often combine chart patterns with momentum signals for stronger confirmation — learn more in our detailed Divergence Trading Patterns Guide, where we explain how RSI and MACD divergence can signal potential reversals.
Using Chart Patterns to Predict Market Movements
Technical analysis relies heavily on chart patterns combined with:
1. Support and Resistance Levels
Psychological price zones where markets pause or reverse.
2. Moving Averages
20-day, 50-day, and 200-day moving averages help confirm trend direction.
3. Oscillators (RSI, MACD)
Momentum indicators help confirm overbought or oversold conditions.
When chart patterns align with indicators and trend structure, probabilities improve significantly.

Successful Trading Through Chart Pattern Recognition
Professional trading is built on structured pattern recognition.
When traders:
-
Identify the pattern
-
Confirm the breakout
-
Manage risk properly
-
Align with broader trend
They improve their consistency.
For example:
-
In a double top, traders often sell after a confirmed break below support.
-
In a double bottom, traders buy after resistance breaks.
Structure first. Emotion last.
Limitations of Chart Patterns
While powerful, chart patterns are not perfect.
Challenges include:
-
False breakouts
-
Pattern variations
-
Overtrading minor formations
-
Ignoring higher timeframe structure
This is why experienced traders combine chart patterns with:
-
Elliott Wave structure
-
Fibonacci levels
-
Volume analysis
-
Risk management rules
For a deeper understanding of how chart patterns integrate with wave theory and market cycles, download our Best Trading Strategies Using Elliott Wave Theory eBook, designed for traders seeking structured, rule-based strategies.
Conclusion: Why Chart Patterns Are Essential for Every Trader
Understanding chart patterns can transform a trader’s approach to the market.
They provide:
-
Clear structure
-
Defined risk
-
Repeatable setups
-
Objective trade planning
In today’s technology-driven trading environment, mastering chart patterns — along with proper risk management — gives traders a significant edge.
When combined with broader market analysis techniques, chart patterns become a powerful tool for navigating financial markets with confidence and discipline.
Traders who want to build a structured foundation in technical analysis can explore our comprehensive educational products, designed to help traders master chart patterns, Elliott Wave structure, and risk management techniques.
Frequently Asked Questions About Chart Patterns
1. What are chart patterns in trading?
Chart patterns are recurring price formations on a financial chart that help traders predict future price movements. They are formed by connecting highs and lows using trend lines and often signal trend continuation or reversal.
2. Do chart patterns really work?
Chart patterns work because markets are driven by human psychology. Since trader behavior repeats, price structures often repeat as well. However, chart patterns should be combined with risk management and confirmation indicators for higher probability trades.
3. What are the most reliable chart patterns?
Some of the most reliable chart patterns include:
-
Head and Shoulders
-
Double Top and Double Bottom
-
Ascending and Descending Triangles
-
Flags and Pennants
Reliability increases when patterns align with higher timeframes and volume confirmation.
4. Are chart patterns better than indicators?
Chart patterns focus on pure price action, while indicators are derived from price data. Many professional traders prefer chart patterns because they reflect real-time market structure. However, combining both often produces the best results.
5. What is the difference between continuation and reversal chart patterns?
-
Continuation patterns (flags, pennants, triangles) suggest the trend will continue.
-
Reversal patterns (double tops, head and shoulders) signal a possible change in trend direction.
6. Can beginners use chart patterns?
Yes. Chart patterns are beginner-friendly once traders understand support, resistance, and trend structure. However, practice and backtesting are essential before risking real capital.
7. How do professionals use chart patterns?
Professional traders combine chart patterns with:
-
Elliott Wave structure
-
Fibonacci retracements
-
Volume analysis
-
Risk-to-reward calculations
They wait for confirmation before entering trades rather than anticipating breakouts prematurely.