Applied Digital Corp (NASDAQ: APLD) operates at the intersection of digital infrastructure and AI innovation. Recent sector tailwinds have fueled strong momentum for the stock. Today, we analyze the Elliott Wave pattern behind its current pullback and emerging buying opportunity.
Elliott Wave Analysis
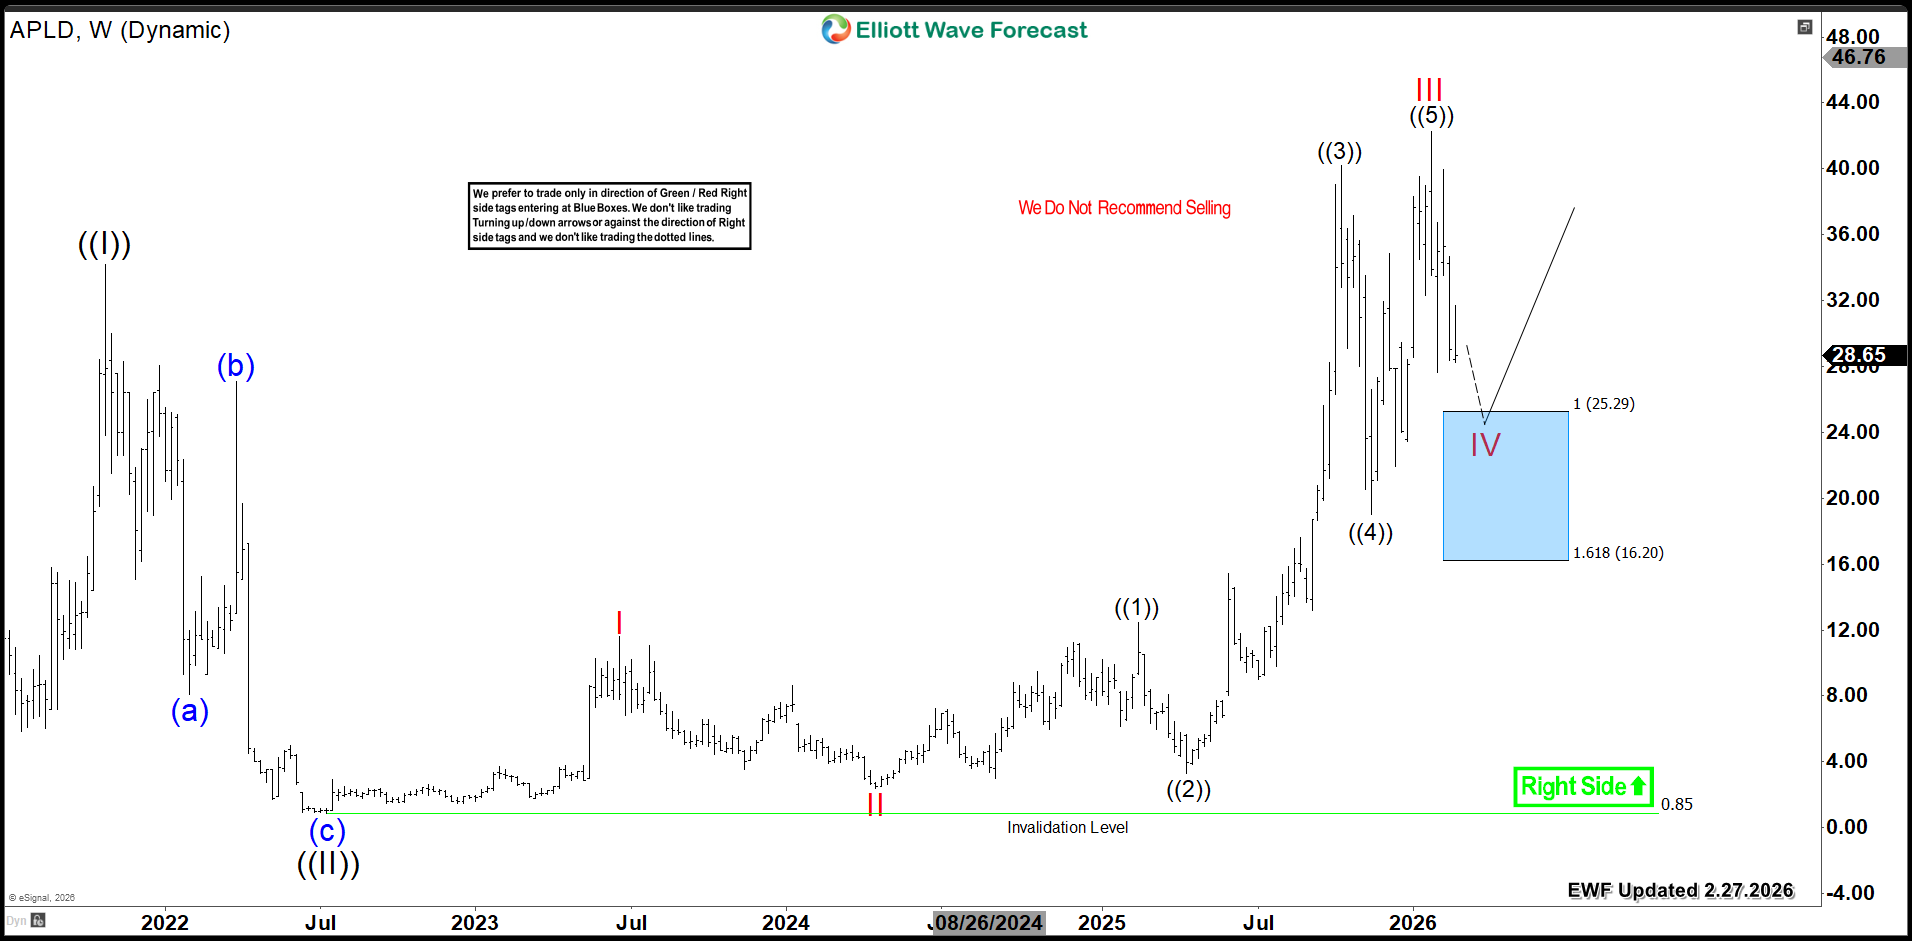
APLD Weekly Chart 2.27.2026
The following video offers a technical outlook for APLD:
Conclusion
APLD bullish cycle support the idea of buying strategic entries during corrective pullbacks. Apply our Elliott Wave methodology for exact timing. Specifically, enter the market after a 3, 7, or 11-swing correction completes. Additionally, our proprietary Blue Box system identifies high-probability reversal zones. This disciplined approach provides clarity and confidence. Ultimately, it positions you to capture the next major advance.
Explore our system to gain deeper insights into this methodology.