From the January 23 high, EURJPY completed a measured three‑swing pullback that reached 180.78. This decline has been identified as wave (4) within the broader Elliott Wave structure. Following the completion of this corrective phase, the pair turned higher in wave (5). However, to fully confirm the bullish continuation and eliminate the possibility of a double correction, price must break decisively above the January 23 peak at 186.87. Until that level is surpassed, traders should remain aware of potential alternative scenarios.
From the wave (4) low, the rally has unfolded in a clear five‑swing sequence, which favors further upside. Wave ((i)) advanced to 182.27, followed by a corrective pullback in wave ((ii)) that ended at 180.8. The pair then nested higher within wave ((iii)). Inside this structure, wave (i) concluded at 183.15, while wave (ii) dipped modestly to 182. The subsequent rally carried wave (iii) to 184.18, before a minor retracement in wave (iv) ended at 183.3.
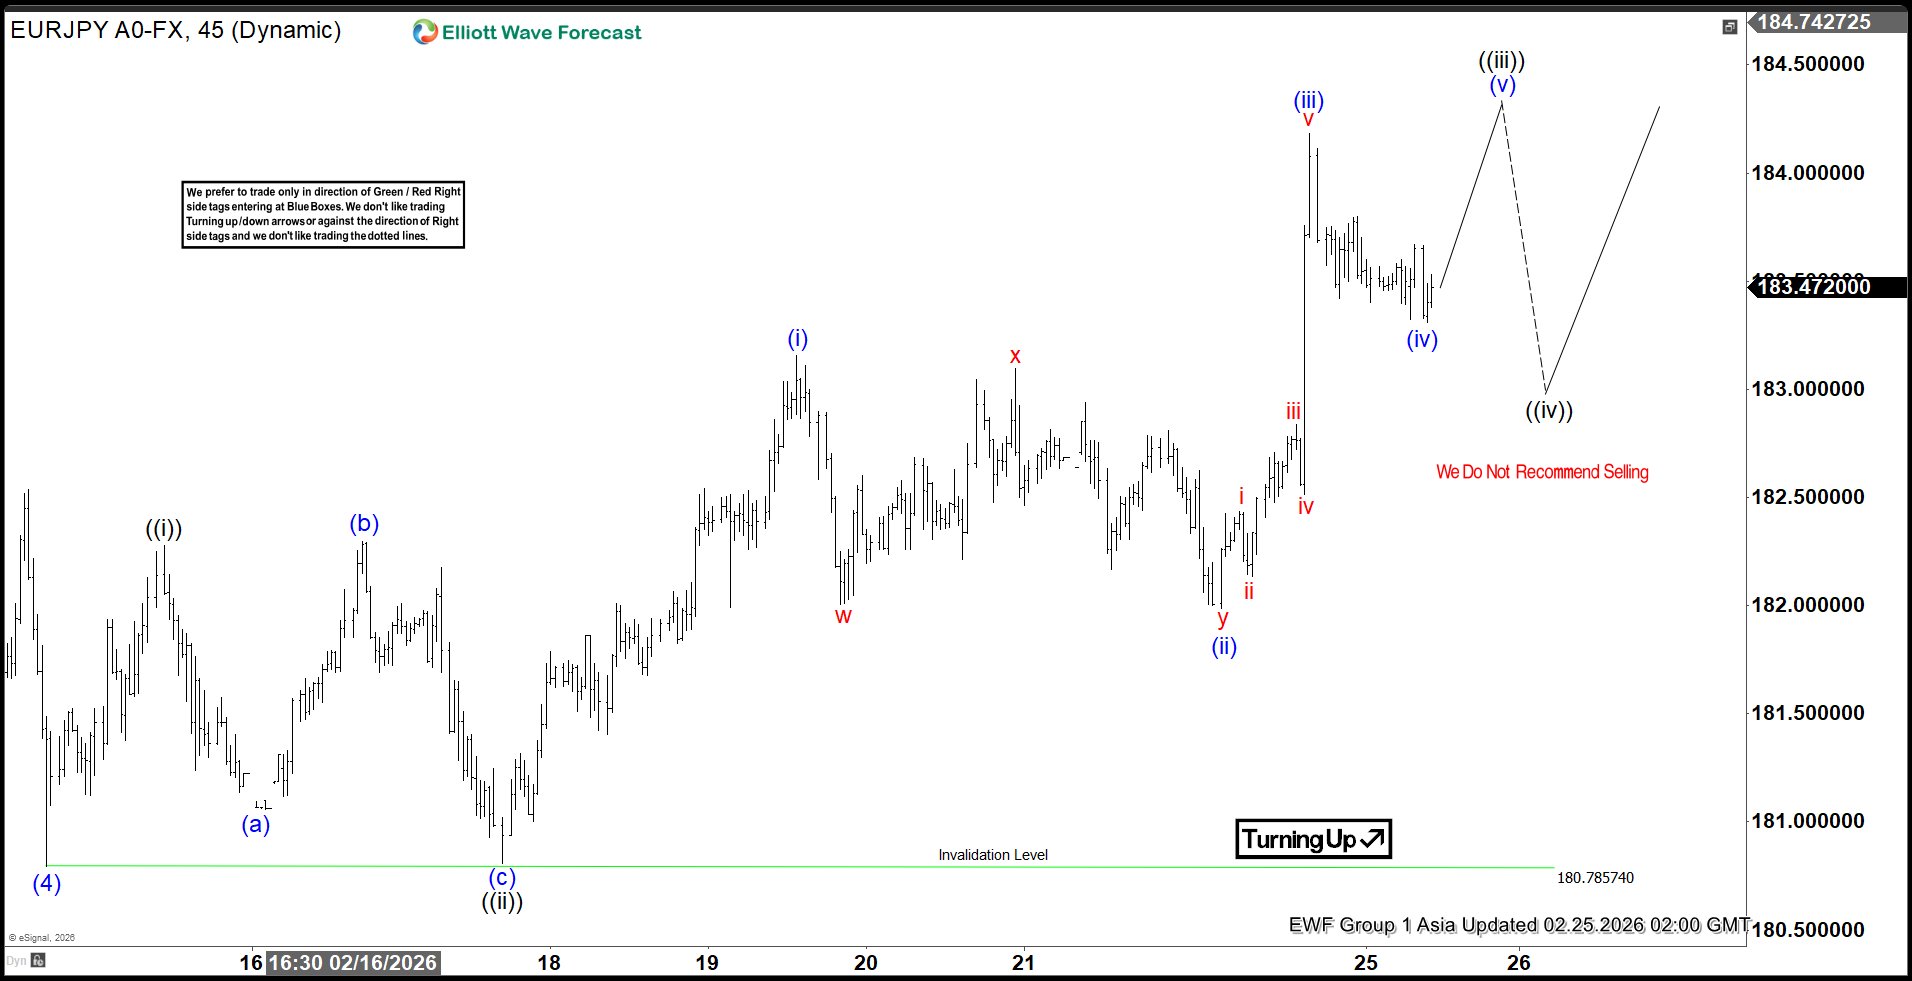
Near term, the expectation is for EURJPY to continue higher in wave (v), which will complete wave ((iii)). As long as the pivot at 180.78 remains intact, pullbacks should find support in the typical three, seven, or eleven‑swing corrective sequences. This technical condition reinforces the bullish bias and suggests that the pair retains potential for further appreciation.