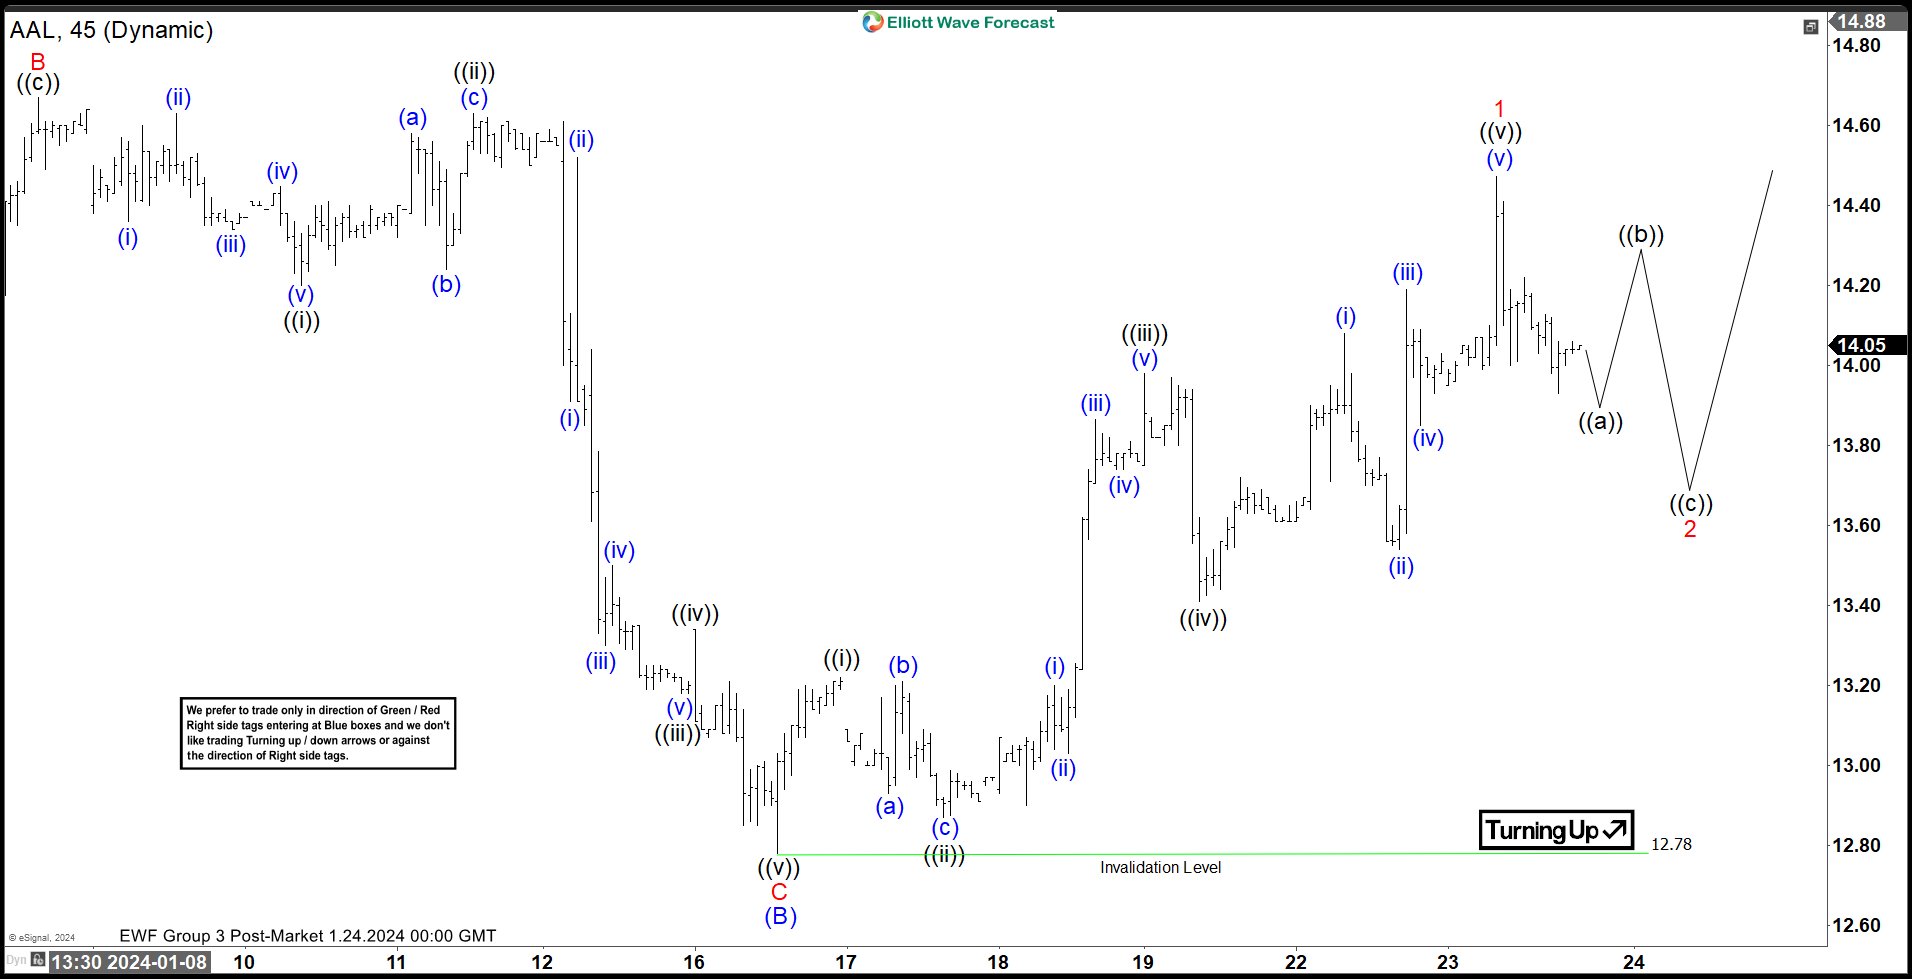
Short Term view on American Airlines (AAL) suggests that rally to 14.65 on December 15, 2023 high ended wave (A). Pullback in wave (B) is proposed complete at 12.78 as the 45 minutes chart below shows. Internal subdivision of wave (B) unfolded as a zigzag Elliott Wave structure. Down from wave (A), wave A ended at 12.89 and rally in wave B ended at 14.67. Wave C lower subdivided into 5 waves. Down from wave B, wave ((i)) ended at 14.2 and wave ((ii)) ended at 14.63. Wave ((iii)) ended at 13.18 and wave ((iv)) ended at 13.34. Final leg wave ((v)) ended at 12.78 which completed wave C of (B).
The stock has turned higher in wave (C). Up from wave (B), wave ((i)) ended at 13.22 and dips in wave ((ii)) ended at 12.87. The stock resumed higher in wave ((iii)) towards 13.98 and pullback in wave ((iv)) ended at 13.41. Final leg higher wave ((v)) ended at 14.47 which completed wave 1. Stock should now pullback in wave 2 to correct cycle from 1.17.2024 low before it resumes higher. Internal subdivision of wave 2 should unfold in 3, 7, or 11 swing. As far as pivot at 12.78 low stays intact, expect the stock to resume higher again after wave 2 pullback ends.


