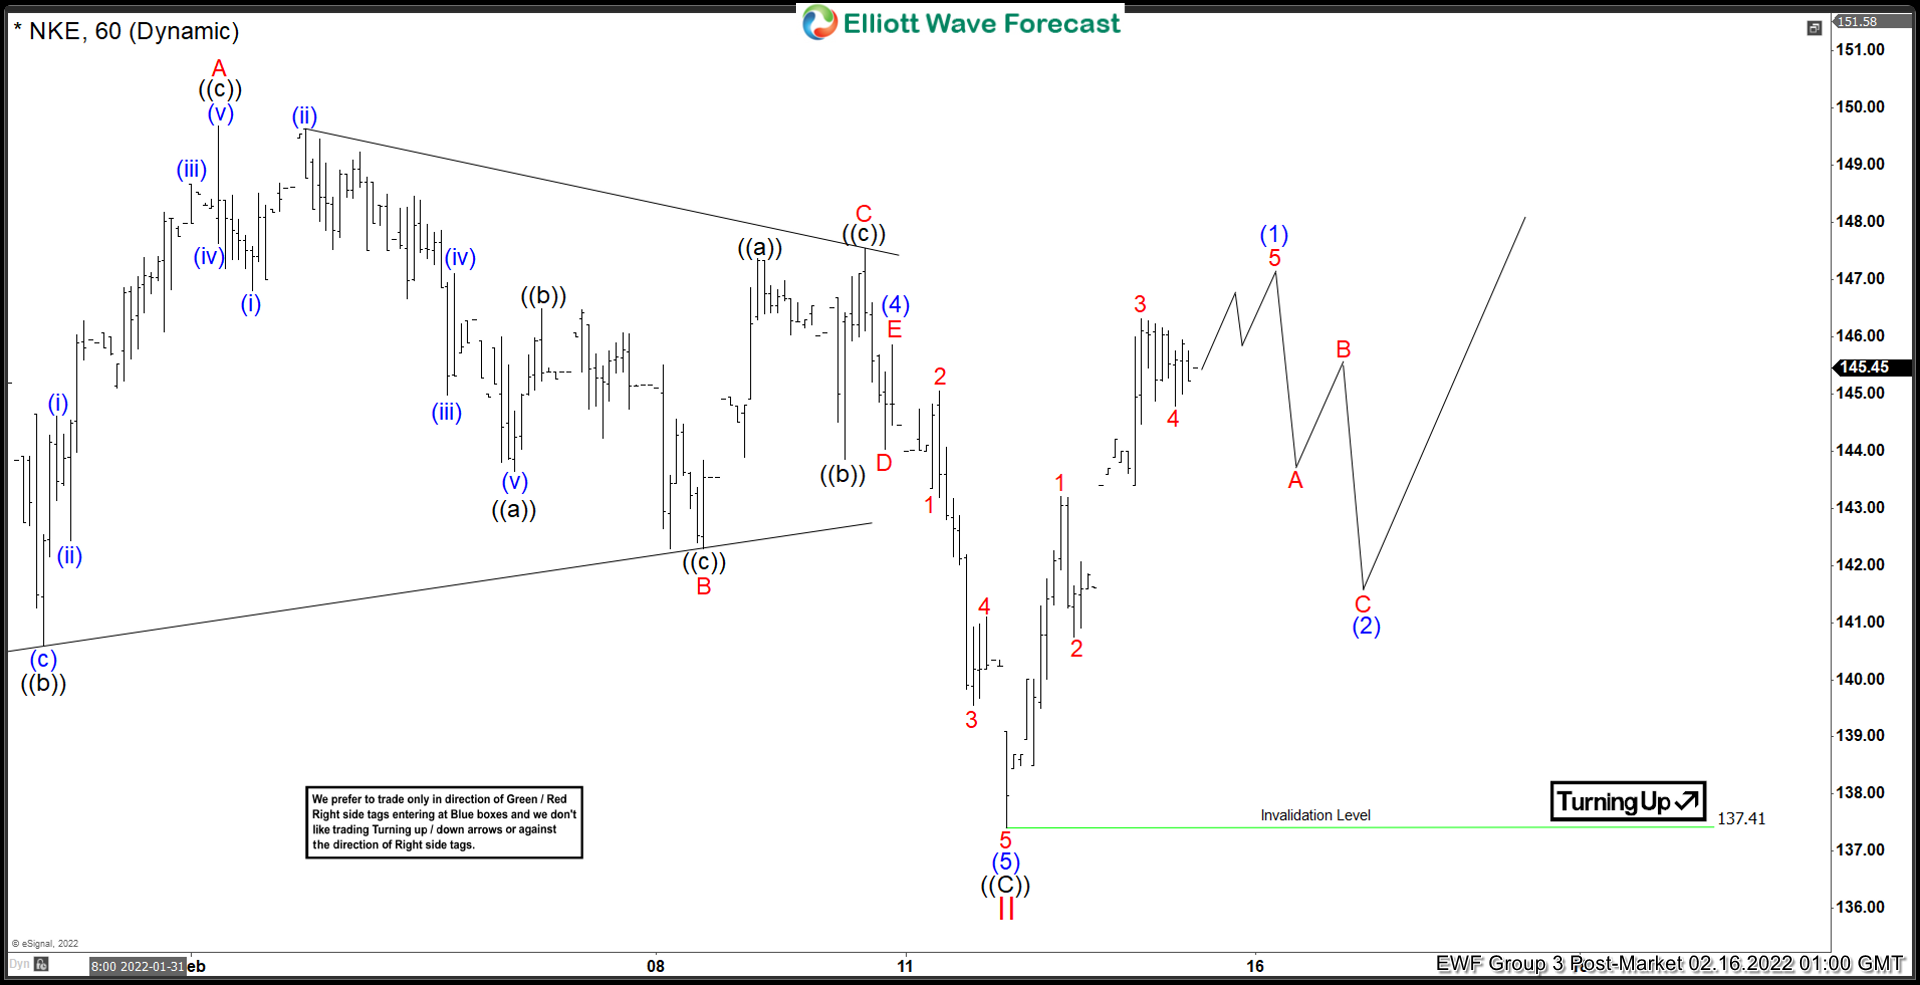
Since bottoming on March 18, 2020 low, Nike (NKE) rallied as a 5 waves into $179.10 which ended wave I on November 5, 2021 peak. Since then, the stock has corrected the cycle from March 2020 low within wave II. According to the 1 hour chart below, wave II pullback is complete at $137.41. The internal subdivision of wave II unfolded as a zigzag structure. Down from wave I, wave ((A)) ended at $155.47, rally in wave ((B)) ended at $171.19, and wave ((C)) ended at $137.41.
The stock has started to turn higher in wave III although it still needs to break above wave I at $179.10 to rule out a double correction. Up from wave II, wave 1 ended at $143.21 and pullback in wave 2 ended at $140.74. The stock resumes higher in wave 3 towards $146.32, pullback in wave 4 ended at $144.57. Expect the stock to rally 1 more leg higher to end wave 5 of (1). Afterwards, it should pullback in wave (2) to correct cycle from February 14 low before the rally resumes. Near term, as far as pivot at 137.41 low stays intact, expect pullback to find support in 3, 7, or 11 swing for further upside.


